A Study Gloucester’s CBD
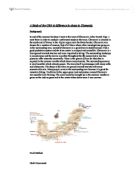
Gloucester is city in the south west of England, situated on the River Severn. Located 114miles from London and nestled between the Malvern & Cotswold Hills.
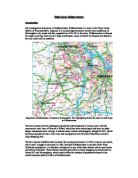
Above: Map of central Gloucester.
The aim of this project was to carry out an urban study, test hypothesis using a range of fieldwork techniques and to work in pairs or small groups.
Hypothesis were set before the project began, these were:
- The CBD of Gloucester is greater than ½ mile in diameter.
- The highest pedestrian counts would be in the CBD.
- Food services in Gloucester are clustered.
- Environmental quality is highest around the outskirts of the CBD.

CBD of Gloucester is more than ½ mile in diameter
Average = (0.8 + 0.6 + 0.67) / 3 = 0.69miles
This hypothesis was accepted. Using the graph of the land use transect [fig.1] (which showed the number of storeys and distance from the CBD), a class map was compiled [fig.2], using bid rent theory as to where the CBD ended. From this information, and after taking an average from 3 circumference readings, from the map, it was possible to see that the ...
This is a preview of the whole essay
CBD of Gloucester is more than ½ mile in diameter
Average = (0.8 + 0.6 + 0.67) / 3 = 0.69miles
This hypothesis was accepted. Using the graph of the land use transect [fig.1] (which showed the number of storeys and distance from the CBD), a class map was compiled [fig.2], using bid rent theory as to where the CBD ended. From this information, and after taking an average from 3 circumference readings, from the map, it was possible to see that the CBD extended to nearly 1mile in diameter, stretching from the centre.
Bid-rent theory
The main assumption with bid rent theory is that in a free market the highest bidders will obtain the use of the land.
The most expensive ‘prime’ sites in most cities are CBDs & have premium accessibility. These sites are usually occupied by department store. Offices also compete as they rely on good transport systems & proximity to other commercial buildings. (A-A)
Away from the CBD the land rapidly becomes less attractive. Industries bids for this land as it is more spacious & less valuable. (B-B)
Residential land is found further out from the City centre as individual householders can’t afford to pay the same rents as shops & industries. (C-C)
The core & frame concept for the CBD [fig. 7]
The highest pedestrian counts would be in the CBD
This hypothesis was accepted. The pedestrian Isoline [fig.3] helps to show the areas where the highest pedestrian counts were. From this it is possible to see that the areas that were actually most populated with pedestrians, during the five minutes observed, was the northwest corner, on the edge of the CBD. Reasons for this result, after studying a map of this section of the CBD, were that there is a school in this area & being lunchtime all the students would be out. Also the CBD is the centre of commerce, tourists, workers & shoppers would always be in the area. There was a low pedestrian count in the south of the CBD, using evidence from the map, it shows this area is an industrial site; therefore the amount of pedestrians would be limited.
Food services in Gloucester are clustered.
This hypothesis was accepted. Using the table below and the NNI formula and theory it was proved that the food services in Gloucester had an Rn value of 0.326 which means they were clustered (nucleated).
Mean (d) = 10.2682/39 Area of map = 19.5175 km
= 0.263287179
Rn = 2d(n/A) Rn = NNI number
Rn = 2x0.263287179 (12/19.5175) d = mean distance
Rn = 0.53 x 0.614832842 n = number of sites
Rn = 0.326(to2dp) A = area of study km2
Nearest neighbour analysis
Nearest neighbour can be used to identify a tendency towards nucleation (clustering) or dispersion for settlements, shops, industry etc.
The formula used produces a figure which measures the extent to which a particular pattern is clustered, random or regular.
Environmental quality is highest around the outskirts of the CBD.
This hypothesis was accepted. Looking at the Environment Isoline [fig.4] it shows that both the highest scores of environmental quality are found around the outskirts of the CBD. The highest score, [+13], is found in the northwest, around the edge of the CBD. There were a couple of anomalies around the CBD, the lowest score, [-22] in the south east. Referring to fig.7 plus the CBD map, it can be seen that the south is the discard zone, a place with heavy industry and poor residential properties, whilst the northwest is the Assimilation zone with better residential properties.
Problems encountered
Land use transect
Certain problems acknowledged, were the fact that at times it was impossible to see what was on the higher storeys, as the windows were covered with blinds, or just too small. A way of overcoming this problem could have been to go in and see, or ask how the land was being used. Other problems included the fact that 30paces was different for different group members; a trundle wheel or other form of distance measuring equipment could have solved this problem.
The transect only covered one side of the road, this could present an inaccurate view of the CBD. It would have been more effective to record the land use for buildings each side of the road.
Pedestrian count
One problem that the group encountered was defining whom to count as a pedestrian. It would have been easier to classify this before leaving the classroom. Another issue was the fact that trust was needed, had the other pairs counted correctly, or made up the results.
Environmental quality
In the areas of Gloucester each pair was given, it may have been hard to see the overall quality, buildings may have been obstructing views making it hard to form a judgement. The mark in quality was also personal opinion, making it bias. To improve this method, descriptors for the polar values could be introduced e.g. –2 being ‘a neglected, over-grown tip’ and +2 being ‘a perfectly kept garden’.
Food Services
The area given to the groups was too large, and also it wasn’t classified before what a food service actually was.
The nearest neighbour therefore could be inaccurate, with the groups classifying a ‘food service’ differently. The measuring dots on the nearest neighbour map were too big, and it was difficult to keep the place where the distances between dots were being measured, consistent.
Sphere of influence
One problem faced, was that people didn’t want to answer the questions. This made the chosen systematic sample hard to obtain and had to be changed to random.
Extension
To extend this study, the land use of the whole area of Gloucester could be studied and then compared to an urban model, to see if it fitted. Also you could use the study to define the type of settlement Gloucester is. Or use Spearman’s rank correlation to look at the congestion of cars and air pollution in the city. Or maybe compare certain aspects in the settlements of Gloucester and Bristol e.g. the sphere of influence or the size of the CBD.