A town planner it would be interesting for me to see if my conclusions were correct. I also chose Winchester because it has a historic background and want to see if it does a strong link to Burgess and Hoyt's land use model.
I have decided to conduct my enquiry in Winchester because I already know that changes have happened in the past and as I live in the area it will be interesting to see what future developments could arise. Also as I am studying future development areas in some of my aims if I became a town planner it would be interesting for me to see if my conclusions were correct. I also chose Winchester because it has a historic background and want to see if it does a strong link to Burgess and Hoyt's land use model.
Burgesses land use model was 1 of the earliest to be developed so I think it will be interesting to see if Winchester fits it especially seeing as it used to be the capital of the United Kingdom.
Methodology
Where I conducted my enquiry
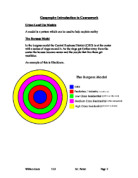
Zone number
Place
Description (using Burgesses model)
Zone 1
Kings Road
Inner suburbs
Zone 2
University College Winchester
Inner city
Zone 3
High Street
CBD
Zone 4
Bar End
Outer suburbs
I conducted my enquiry during May 2005. I did this to answer the aims I set myself. The aims of my enquiry can be seen on the first 'introduction page'. The reason I choose these aims was because I know Winchester is constantly changing from secondary data I have found on the internet and I want to find out what changes are going to be made in the future, what the impact will be and how Winchester currently changes. I have chosen to mainly look at the housing developments in each zone as there is a bigger market for this compared to tourist developments.
I set out early from kings school and headed down Kings Road where I started to collect my first series of data. First of all I took a photo of the area which can be seen at the beginning of each Zone's data. I next labelled a sketch of the area where I added to it the characteristics of the area and what information could see. Once I had done this I walked down to the edge of Kings Road and began a traffic count, I did this by counting the amount of cars that where going in the direction of the city centre and out of the city centre in 5 minutes. We were split into partners so 1 person could count outgoing cars and 1 person counting ingoing ones, this made it easier for me to keep count. I tallied the results in a table. Whilst I was counting the cars going in and out I also made a note of what type of vehicle it was, I did this so I could see if there was any similarities between what part of the city I was doing the count and what type of vehicle was travelling through. I next took a pedestrian count where I counted the amount of people walking in and out of the city as I travelled through it, I did this in all the zones apart from zone 3 where I split it up into 3 sections and took a 1 minute pedestrian count fro each section.. Next I conducted an EQA (Environmental Quality Assessment) where I described the type of area it was, this will help me to see if there is any changes in the landscape and how the area is built up. I then walked down Romsey Road until I came to the end of my first zone. At the end I drew out a 'land use map' which shows me a rough idea of what the area is used for, whether it is mainly residential , commercial, industrial etc.
Once I had done the first zone I continued to use the same methods of collecting my primary data for the other zones, making it a fair enquiry. I collected all my data in a booklet which had all the tables drawn out in preparation so that I wouldn't have to waste time when out on my enquiry. Below you can see the tables I planned to put my data into.
Vehicle survey table
cars
vans
Lorries
trucks
buses
cycles
Motor bikes
others
In out
In out
In out
In out
In out
In out
In out
I conducted a vehicle survey to see if there was any relationship or contrast in the number of incoming and outgoing vehicles in each zone and if it would link to either Burgess or Hoyt's theories.
Pedestrian survey
in
out
I chose to do this to see if there was any changes in the amount of pedestrians throughout each zone. This will help me to see if there is a link with the amount of people in a zone to what it mainly consists of. E.g. residential area.
Land use percentages
The land use percentages show me approximately what percentage of each zone is being used for what purpose. E.g. 50% leisure. This will help me to see if there is a link between the amount of residential buildings ...
This is a preview of the whole essay
Pedestrian survey
in
out
I chose to do this to see if there was any changes in the amount of pedestrians throughout each zone. This will help me to see if there is a link with the amount of people in a zone to what it mainly consists of. E.g. residential area.
Land use percentages
The land use percentages show me approximately what percentage of each zone is being used for what purpose. E.g. 50% leisure. This will help me to see if there is a link between the amount of residential buildings in each zone as you get closer to the CBD, important in looking at Burgess and Hoyt's theorems.
Environmental Quality Assessment (EQA)
Dark
2
3
4
5
Light
Very dirty
clean
Much street furniture
No street furniture
No landscaping
Lots of Landscaping
Noisy
Quiet
Lots of parked cars
No parked cars
Broken pavement
Level pavement
Smelly
Fresh
Low cost buildings
High cost buildings
Poorly cared for houses and gardens
Well cared for houses and gardens
I conducted one of these in each zone to see if there was any change in the quality of the environment as I moved through each zone. This will help me to see if burgesses theory is correct that if you get closer to the CBD the quality decreases.
After I had collected all my information on the day I wrote a questionnaire which I asked people who I found in each of the zones, this gave me an idea of what people thought of the area and there ideas on future changes.
I took all these pieces of information so that I can see if there is an overall theme that as the distance increases from the CBD so does the residential quality as suggested by Burgess' theory. The reason that the quality should decrease is because close to the CBD there is high density of housing from buildings like tenements being built for workers, high levels of pollution and the increase of land prices. So, the quality increases because the houses become lower density and wider availability of land. By collecting field sketches and EQA's I can see if the area does decrease in residential standard as you get closer to the CBD.
After I completed this section of my aims I went on to investigate my 2nd and 3rd aims. With these I again collected EQA's, traffic counts and pedestrian counts but from areas I found out could be new developments. With the knowledge that the population of the South of Britain is increasing it is important to see possible areas and see if they will develop.
Below is a detailed area map of Winchester. It shows the main transport links to and from the city.
Overall analysis of vehicle survey, pedestrian count
and land use map
From looking at my 4 sets of data on the same graph, I can see that there is a similarity of the amount of people in each zone to what it is used for. I can see that there were no pedestrians in zone 1 and 55 total vehicles. The main use of this zone was high cost residential (75%) and a total of 90% residential. This would imply that the amount of people travelling were going to work, this information was collected at approximately 9.20am. However if I recorded this data an hour earlier the pedestrian count would have been very high, due to all the children walking into school. If I now look at zone 3 I can see that 70% of the land is used for industry, I.e. shops etc, from looking at my pedestrian counts I had a total number of 111 people walking through the zone. This is an extremely big number compared to all the other zones. This is because the zone is attracting people to come and use the shops, restaurants and other facilities. This proves Burgesses theory that more people use the CBD because it has the highest industry. Now if I finally look at zone 4 I can see this also proves Burgesses theory, there was only one person who was travelling through the zone and 29 vehicles, some of which were either lorry/trucks or vans which could be used for travelling goods. Overall I can see that there is a direct link between the amount of people using a zone and what characteristics it has, the bigger the industry in the zone the more people are using/ travelling in the zone.
Overall field sketch analysis
From looking at all my sketches I can see that the most expensive materials and most work has gone into zone 1, it has a lot of hard and soft landscaping to make it attractive. It is also set back from the road so there is no noise or sight pollution. This was similar to zone 3 because it did have some expensive materials and also because it was mainly for commercial use it needed to look attractive or people wouldn't want to visit it. Zone 2 however used mainly cheap materials because it was mainly designed for student accommodation so doesn't need to be as expensively made. The materials used in zone 4 were similar to this as it had a lot of industrial buildings and material like plastic were being used.
After looking at the 3 different proposed sites ihave chosen to build the new housing development on site 3, Bushfield camp. I have chosen this site because:
* Is a brownfield site (has already been built on).
* Has access to main road and motorway so good for commuters.
* There is a lot of available area.
* Supermarket close by
* Highest EQA score
* Cheap land
However there are some disadvantages against this area:
* It is quite far away from CBD
* Noise and air pollution created from nearby roads.
* Planning applications have previously been turned down
* Poor soil conditions making it hard to build on and
* Land would ahev to be cleared for development.
I did not chose the golf course because:
* It is already being used for recreational purposes
* The land is steep so hard to build on and
* doesn't have very good transport links.
However this site does:
* Have a lot of open land
* No visual or noise pollution
* Very clean and
* The council look after it so they would not allow the views to be damaged.
Site 1 which was the bus station was not chosen because:
* It has a one way system so accessibility would be hard.
* Located in the Cbd so expensive to buy and build on
* It is dirty
* Not a very big area to build on.
This site is however:
* Verty flat and
* It is in the centre of town so easy to access for people working in the CBD.
But I think that overall Bushfield camp would be the nicest area to develop as it has good transport links and is a big wide area so housing wouldn't have to be densely built up.
Conclusion
From my results I collected on my field trip to Winchester I can make a conclusion for my first aim. My aim was:
. How and why does Winchester change as you move form the rural urban fringe to the city centre?
The first thing I notice about the change from ZONE 1 to ZONE 4 is the use of land, in ZONE 1 the land is predominantly made up of residential but as you begin to come to the end of the zone there are a few services, these services increase as you enter ZONE 2. In ZONE 3 there is very little residential and a lot of industry and as you finally enter ZONE 4 the residential percentage goes up and there is still some industry. This set of results support Burgess' city theory that it is separated into sections. So from this I can say that, as you get closer to the CBD the percentage of services increase and the percentage of residential decrease.
From looking at my traffic counts and adding up the totals for each zone I can see that the zone with the greatest number of vehicles travelling through it during my 5 minute count was ZONE 3, this is the main CBD area and so it is expected that more people are wanting to be visiting this area. I can also see that in ZONE 2 & 4 there is the lowest number of vehicles, this could be because they are so close to the CBD there are traffic systems to try and cut down the amount of people entering the CBD and ease congestion. From this I can state that as you get closer to the CBD the amount of traffic increases.
From my EQA scores I can see that I got the highest result in ZONE 1 and the lowest in ZONE 4. This tells me that the quality of the environment is highest in a high cost residential area, this could be because if an area is expensive to live in then the area has to be of a good quality so that it is desirable. This shows that there is a direct link between the quality of the environment and the land use, the more expensive the land the higher the quality.
From looking at my field sketches I can see that in ZONE 1 the houses are big, have a lot of landscaping, this changes in each other zone as they are a lot smaller and don't have the same expensive materials, there is also a lot of high rise buildings in the CBD to save space. This tells me that the closer you get to the CBD the more expensive the land is and so there are more high rise buildings.
From looking at all the information I collected I think that Winchester mostly does fit Burgess' land use model, as there is a definite decrease in the residential quality as you get closer to the CBD and an increase in residential buildings as you get further away. I think this is because, as I mentioned, earlier there is a higher density of houses at you get closer and so less money is being spent on building materials making it less attractive and the EQA scores lower and the rose diagram area smaller. However, the outer suburbs in Winchester are a lot bigger than the concentric ring that Burgess drew, I think is because as time has progressed there is a bigger increase in the demand for housing with such things as increased divorce rate, lower mortality rate, bigger population, larger families, schools and colleges being near to the area.
Because of all these factors more houses are needed and the outer suburb ring is growing, this is why I investigated the need for housing in the future. So this is answering aim 2 which was:
2. How and where will Winchester change in the future?
In the future I think there will be an increase in the demand for housing pushing the outer suburbs into the rural urban fringe meaning eventually that cities could join because of the increase. I have looked at 3 future development spots and chosen Bushfield camp to be the site where I would chose to develop housing.
From my research I think that I have the right amount of information to answer my 3rd aim.
3. What will be the impact of future change and how can we plan for this?
I think that in the future there will be:
* More people creating an increase in the demand for housing thus increasing the size of towns, especially the outer suburbs.
* Greater amount of cars on the roads, creating more pollution.
* Pubic transport will be more greatly used, making it more busy to travel by.
* Because of the increase in demand for housing I think that there will be less Greenfield sites (areas that have not been developed) and less areas for children to play in.
* Greater demand for public services. E.g. fire and rescue services
So to plan ahead for this I think that:
* The greenbelt idea where cities and towns are only allowed to expand to a certain point should be adopted in all areas.
* More cheap public transport should be made available.
* Encouragement towards the public for more jobs in these services.
* More land made available for recreational facilities like children's parks and gardens.
Evaluation
During this enquiry I have had to collect lots of different pieces of data. Here are the problems that arose when collecting my data.
Pedestrian counts:
Because these where taken at different times of day at each zone I think it would make it more accurate to take them over a longer span of time, for maybe 12 hours instead and have the survey going on in the different zones at the same time to make it fair.
Vehicle counts:
Even though there where 2 people counting the cars I think that the results could have been made more accurate if they were being counted by computer to avoid the problem of human error. I think this method could also have been improved by again taking the results over a longer period so that I can see how many people travel through each zone about the time they would be going to and from work, taking children to school and at lunchtime.
Land use maps:
These percentages were made by myself on a general overview of the area and so therefore are susceptible to human error. This could be improved by putting each building in each zone into a category and seeing what percentage of buildings were in each.
Field sketch maps:
These were hand drawn and although I did these by sight they could have been made more accurate and more interesting to investigate if I had a price view of how much each building cost, this would also help prove or disprove Burgesses theory.
EQA/rose diagrams:
I think these went quite well as I got the expected results proving Burgesses theory, however I could have taken a wider range of EQA's throughout each zone to see if it was just one area that had that kind of EQA result.
Questionnaire's:
These could have been made better by asking a wider range of people and perhaps having questionnaires posted through the doors of residents to see what people living in each area thought as I could have been asking people new to Winchester and therefore those who don't have as great an insight.
Some other limitations I came across where that I only collected my data on 1 day and this was taken at different times in each zone making the results unfair. Also my results and conclusions could have been subjective and therefore biased towards a certain thing or result. Also because I only collected one set of data my results could be anomalous and I wouldn't know, this would also be made clearer if I had taken more results. As I have already mentioned I only took my results at 1 time of day in a year and it would be interesting to see if these results changed over a period of time, to see this I could take results on 3 days a week for a year to get a more accurate conclusion.
Overall I think I conducted the enquiry to the best of my ability although I could not avoid the elements of human error. However, if I wanted to extend the enquiry I could provide more results from contrasting cities, for example Basingstoke, and see how I compares with Winchester and to the Burgess and Hoyt model. I could also repeat the enquiry in another 5 years and see what changes have been made and what future ones could be. Another thing I could do is do a wider range of places in each zone making me less likely to get anomalous zone results. The last thing I could do is just compare a certain zone, for example the CBD, to Burgesses model and see how it compares.
I think that the conclusions I have made from this enquiry are as accurate as they can be but they still might be subject to human error.