Land Use Plotting (Betws-y-Coed)
Questionnaire (Betws-y-Coed)
Pedestrian Count Survey (Betws-y-Coed)
Measurement of Footpath Erosion (Betws-y-Coed and Swallow Falls)
Traffic Survey (Betws-y-Coed)
Environmental Index (Betws-y-Coed)
Litter Survey (Betws-y-Coed)
Types of Shops (Betws-y-Coed)
It was not possible to complete all the field study work individually in the time we had available so different individuals and groups performed separate tasks, visited different sites and lastly put all the results together when we returned to school. Personally, I completed the field sketch, the land use map, a traffic survey, the ‘types of shop’ table and the environmental index by myself. Our group carried out the questionnaire and the footpath erosion together, as a group. The other fieldwork items were carried out by separate members of our group and transferred soon after.
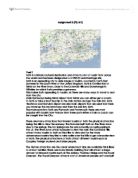
We travelled to Betws-y-Coed on the morning of 1 April 2003. Betws-y-Coed is situated inside the Snowdonia National Park. First, we stopped at Swallow Falls, which is situated 2 miles directly west of the town of Betws-y-Coed on the A5.
There was ample parking along the A5 and within the hotel car park opposite Swallow Falls. A charge of £1 was made to view the falls. The £1 entrance fee at Swallow Falls is used to maintain the upkeep of Swallow Falls and also Betws-y-Coed itself. Charging an entrance fee to view Swallow Falls may deter some people from visiting regularly. If this were the case it would help to limit litter, noise and pollution. The falls are beautiful, spectacular and dramatic. I drew a rough field sketch while I was there (Appendix 14). On the day I visited rainfall had been average and the water cascaded over rocky outcrops as rapids and areas of white water into a plunge pool. Overhanging vegetation could be seen on both sides of the river. Areas of high erosion existed between the rocky outcrops. I noted that steps and viewing areas had been cut into the bank of the river. There was a steady stream of tourists passing through the entrance gate to the falls many of whom stayed a long while whilst enjoying the scenery. The scenery is definitely the main factor that attracts tourists to this area.
At Swallow Falls I measured footpath erosion to indicate problems caused by tourists using a piece of string and a ruler (Appendix 12) to indicate problems caused by tourists. We recorded our results in field booklets. We stretched the string the width of the path and measured the depth to the floor from the string every twenty centimetres along the string. In carrying out this task we were asked to consider as to whether we thought the erosion, if any, was due to use by tourists or from natural causes (or even if both factors appeared to have affected the rate of erosion.)
After visiting Swallow Falls, we then travelled on to the town of Betws-y-Coed where I completed a land use map of the main street to suggest whether, and in what ratio, buildings were intended for tourists or locals in the area. I started at the ‘Conwy’ end (Appendix 2). We also performed this task to discover where particular shops are according to whether they are tourist or local based e.g. near to the centre of the village or closer to the outskirts? I assessed what the buildings were used for and divided them into different categories, as follows:
C Commercial
H Hotels
B Bed and Breakfast
A Self Catering / Apartments
E Entertainment
R Residential
X Derelict
T Church
O Open Space
Once I had completed the land use map, I carried out a traffic survey (Appendix 9) to indicate possible congestion problems. I started at ‘Site J’ and recorded the amount of cars passing each way within a five-minute period. I did this at 10 sites (A – J on and off the main road) in an irregular order. Whilst carrying out the traffic survey, I noticed that sites A + F were very close together. For this reason, I didn’t think that they would provide the best possible results. In order for them to provide good, reliable results, I thought that I should move both sites twenty metres away from each other (as shown on Appendix 3). By using my own initiative in this way, I believe the results became more varied but also more accurate. The other members of my group also agreed with this suggestion and they used the new site positions in each of their surveys.
I was also given the task of measuring litter (Appendix 8). A plastic grid that was divided up into roughly one hundred squares was used by throwing the item completely randomly (with eyes closed) at various positions on the footpaths. The framework was called a quadrat. I then recorded the amount of litter that was found under the quadrat by using the squares as a guide (if the litter occupied 3 squares then I presumed that the overall result was three percent). For this litter survey, I kept sites A + F in the same positions as I had used for my traffic survey.
Another task I was allocated was to perform an Environmental Survey where I gave the following aspects of the village marks out of ten (Appendix 7):
Building condition
General housekeeping
Street furniture
Noise pollution
Air pollution
Litter
Dereliction
The idea behind this was that if one of these categories received ten out of ten, then that would be the best possible mark. For example: if Dereliction were awarded full marks, this would mean that there is no dereliction at all. The same applies for all the other groups with the exception of Noise Pollution for which the least marks would be the best result.
I also had to record data in connection with types of shops and their uses.
I performed this task whilst completing the Environmental Survey (Appendix 6). To do this, I entered data in a three-columned table – Convenience, Comparison and Service, the idea being to divide the group of shops by assigning a column for each shop (either Convenience, Comparison or Service). To add more detail to the data set, as I was collecting the results from the above method, I decided to mark each shop that I suspected was there mainly for the visiting tourists.
I performed a pedestrian count survey (Appendix 11). I recorded the number of pedestrians passing by in a five-minute period at 10 different locations. I also measured the pavement width at each site. Again, sites A + F remained in their new positions.
Groups of students presented a questionnaire to people at hand in the town (Appendix 13). I was in a group of three students and we questioned five people during the course of one hour. The aims of the questionnaire were to discover where the people came from, how far they had travelled, the form of transport they used, whether or not they were regular visitors and their opinions on traffic in the area. Our sampling technique was to select every tenth person that passed and ask them to spend some time answering our questionnaire. When we returned to school we put together the results of the different groups to provide an overall picture of where people had travelled from to visit Betws-y-Coed.
Results and Analysis
Measurement of Footpath Erosion
I noted at Swallow Falls, (opposite the location where I drew my field sketch (Appendix 14)), that the erosion was easily noticeable just by glancing at the footpath. The path had a total width of 1.2m and a depth of 16cm 40cm along the footpath. The erosion at Betws-y-Coed was less noticeable. The width of the footpath was 0.2m longer but the depth at its deepest point (80cm along) was exactly the same (16cm), (Appendix 12). What I was not able to determine was when the footpaths had originally been laid. This would obviously affect the results since erosion occurs gradually over a period of time.
Whilst measuring footpath erosion at Swallow Falls and at Betws-y-Coed, I concluded that both erosion points were caused almost completely by human use. I came to this conclusion because there were plenty of trees at both of the chosen sites to provide shelter from wind and rain and also to help to hold the soil together and prevent soil erosion. Therefore, humans must carry most, if not all of the blame for footpath erosion in the Betws-y-Coed area. Erosion is not always caused by humans, but the trampling and eradication of vegetation by feet that in turn causes natural erosion, definitely is. This is all the more noticeable in honeypot sites such as Betws-y-Coed. The soil in the whole Snowdonia area is thin and often contains peat. This makes it much easier to move than if it consisted of half a metre of clay soil, for example. Rainfall is a very common factor in soil erosion. In places of high rainfall, like Snowdonia (which regularly receives up to 2,500mm of rainfall annually), the rain can shift great quantities of soil especially if the area has been grazed low, as is the case in and around Betws-y-Coed. Paths gradually become wider over time - when the original path becomes worn and muddy, walkers inevitably try to skirt round the path and in doing so, widen it. This extent of footpath erosion was not visible at the places I visited but at many honeypot sites where walkers congregate, this is the case.
Cyclists can also cause erosion problems as large tyres with deep tread can erode top soil and damage low-lying vegetation. However, cycling is legal on almost all roads, paths and bridleways. It is a form of transport (and exercise) that can be enjoyed by the whole family without generating any pollution. I noticed that cyclists at Swallow Falls had caused a substantial amount of erosion. Evidence was easy to come by as tyre marks could be clearly seen on the majority of dirt tracks. The management could combat this problem by making asphalt paths for all members of the public but this could result in another problem in that rainwater would not soak away as easily and could cause water to pool on the surface, which would in turn wash all the soil away anyway, which is exactly what they are trying to prevent now!
Land Use Plotting
(See Appendix 2). Most of the buildings in the town centre were commercial shops. There were also hotels, bed and breakfast and self-catering accommodation as well as numerous residential properties. There were two churches and two buildings connected with entertainment. In four cases it was difficult to distinguish whether buildings were hotels or bed and breakfasts, so I decided to split the results evenly between the two. I was unsure as to whether one of the buildings was residential or commercial as it was in a bad state of repair so I labelled it as an ‘Other’. I noticed that many of the original buildings faced north. I later discovered that this was due to the fact that it was not fashionable in Victorian times to have a ‘sun tan’.
Traffic Survey
The results showed that most traffic was heading in a westerly direction towards Swallow Falls (Appendix 9). The results also showed that the most common method of transport was the car. Coaches passed at regular intervals – not surprising for a tourist area. The surprising thing was that they were mostly heading South towards Conwy and considering that it was early in the day when I completed my traffic survey, I would expect most coaches to be journeying through Conwy in the direction of Betws-y-Coed to spend the day there (as shown by my desire line map (Appendix 4)). The sites situated on the main road were undoubtedly best to obtain results from as the traffic can only be travelling in two directions and is unlikely to be using the road as a ‘turn-around’ point (as lots of side streets are often used for). I learnt that 91% of people that visit the park do so via private motorcars from the ‘Environmental Conflicts’ leaflet. This statistic is worrying and an increasing cause for concern in my opinion. All groups and associations associated with The Snowdonia National Park appear to do all they can to persuade visitors to leave their cars at home and switch to alternative methods of transport but it does not look as if their efforts are working too well.
Litter Survey
There was little evidence of any litter throughout the village (Appendix 8). The modal type of litter was chewing gum but as chewing gum is sticky and difficult to remove, this came as no surprise. I do not feel that Betws-y-Coed should be too ashamed concerning the presence of litter as all areas around the country encounter the same problem. The area in general was very clean. Site ‘B’ was the area where I found most litter but since it consisted completely of cigarettes, they may just accumulate as each day passes if the area is one that workers use consistently. Although the National Park Authority is not legally responsible for the collection of litter, it does spend a substantial amount of time and money clearing refuse. While I was completing the traffic survey I noticed a distinct absence of refuse bins and although there was little litter, I think if the amount of bins were to be increased, litter would decrease even more.
Pedestrian Count Survey
(Appendix 11). There was roughly an equal amount of people travelling in both directions - towards Conwy and towards Swallow Falls. There were a slightly higher number of pedestrians travelling towards Swallow Falls. This can be explained by the fact that there are lots more to do in that direction close by. Sites D, H and J had the most pedestrians passing them – these are areas that shoppers pass regularly and which are situated close to toilet facilities. Site A had very few people passing in either direction, two in total, probably because the site was off the main road and near the Swallow Falls end of the village (where there are less attractions). In my opinion, the pavement width seemed to have no effect on the numbers of pedestrians. However, where there was no kerb, the number of pedestrians was fewer.
Questionnaire
From the results it can be seen that most visitors came from the North and the East from a wide range of locations. There was also one visitor from abroad (Appendix 13). Our individual group’s results showed that the main modes of transport were coach and car. They also showed that there were varying opinions as to whether traffic in the area was congested or not and that there was an even split between regular and one-off visitors. Although only one visitor in my survey was from abroad, I did notice a number of foreign number plates, indicating that Betws-y-Coed must be a popular place for tourists.
Environmental Index
At all survey points, building condition, general housekeeping, street furniture, air pollution, litter and dereliction are very good. Only the amount of noise has a poor result. The noise was generated from the amount of traffic although it wasn’t any worse than any other town or village, it was still noticeable. Also, the noise from the river was rather loud but I didn’t class this as a pollutant, it was more soothing than annoying. The litter scores in my environmental index were relatively high (Appendix 7). This backs up my suggestion in the litter survey that the area in general was very clean. Site ‘F’ came top of the environmental index whereas sites ‘A’ and ‘C’ finished last (eight points behind.)
Types of Shops
I discovered that there are several large craft shops in the village (one of which is called ‘Drift’ and specialises in items made from driftwood). This along with a pottery and an art gallery are run by local craftsmen and help to uphold the tradition in the village. I noticed that the service shops outnumbered the comparison and convenience shops. Most of these shops were aimed at tourists in general – see types of shop graph (Appendix 6). It was clear that this was indeed the case since the shops primarily sold items such as bikes, hiking equipment in general boots, raincoats etc, souvenirs e.g. pencils, badges etc and also more unusual objects like canoes and expensive kites which are usually only found in shops aimed at tourists. There were five comparison shops, ranging from a bike shop to an arts and crafts shop. Just three shops were aimed at locals whereas the other fourteen were primarily attempting to attract tourists. This may be because the number of tourists entering the village each day easily outnumbers locals travelling through the village. Shopkeepers recognize this and are more likely to assemble a tourist-based shop than one intended for locals. This is what I would expect at a rural tourist area, larger commodity shops being more likely to be found in areas of much denser population.
Overall
Factors that may have influenced some, if not all, of the surveys carried out are: 1) some primary schools in the area were closed on the day of our visit – the schools being used as polling stations for the local elections, 2) our visit took place in ‘low’ rather than ‘high’ season. These factors may have resulted in the number of people visiting Betws-y-Coed to have fallen on the day that I visited. To confirm this theory I enquired at the tourist information centre and the assistant there said that it was indeed much busier at weekends and holidays.
Conclusion
Having investigated the physical and human features that attract tourists to Betws-y-Coed, I would conclude that the main attractions are the beautiful scenery and the variety of wildlife that the village has to offer. The fact that the village is easy to access by both road (the A5) and rail adds to its success as a tourist centre. The geographical features of the area such as rivers, hills and valleys, the relatively mild climate and the quaint villages result in it being suitable for a wide range of activities.
The consequences of tourism on Betws-y-Coed are both good and bad. The large number of visitors that the area attracts can cause problems with excess traffic, parking, footpath erosion, environmental pollution and excess litter that in turn can create visual eyesores, harm wildlife and produce noise pollution. However, there are also advantages in that the tourists bring money to the area that helps with the upkeep of the town and also to surrounding areas.
Ways that my research could have been improved are numerous, for example; I could have managed the tourists in a different way whilst conducting the survey where I asked questions to members of the public - instead of asking where they had come from, I could have looked on their number plates (all congregated into one area - the car park) which would have told me exactly where the car came from.
Betws-y-Coed does exhibit the features of a honeypot site as queried in my hypotheses. It is a people magnet. It draws people from different backgrounds, different age groups, with different hobbies from a wide array of locations. Backgrounds and ages range through the whole spectrum, locations include the entire United Kingdom as well as abroad. Hobbies that attract tourists to the area of Betws-y-Coed range from fishing to paragliding. The Betws-y-Coed management has achieved the task of attracting a wide variety of people by maximizing the potential of its geographical location and providing numerous services and facilities that tourists require to take part in the many activities that the area has to offer. The money that the tourists spend in Betws-y-Coed pays the taxes that the area has to pay. Tourism is an important part of the Betws-y-Coed economy.
Evaluation
I believe I have managed to prove my hypotheses throughout this investigation but my results relating to the hypotheses may be a little suspect because of the methods I adopted. For instance, as a group, we only visited the village once, in low season. I personally travelled to the area before the school visit but I did not record any data at that time. If I had more time, I would like to revisit Betws-y-Coed at a busier time – maybe at a weekend or school holiday.
A problem with all the investigations and surveys I carried out is the fact that I did not sample the whole area, only selected sites which may not provide a fair overall conclusion to the results I have collected from them. Another problem was that it was very difficult to adopt an unbiased way of asking certain people my questionnaire. I intended to ask every tenth person that walked by but in reality, this sampling technique wasn’t very effective as it was much to hard to keep track of the number of people that went past. At times, I ventured close to the bus park which may have affected my results as a coach full of tourists may have just got off their coach and passed me at roughly the same time, providing a group of similar statistics. If I had had more time on the day, I would have liked to carry out a more thorough investigation on the area’s erosion problems and study the footpaths more closely to provide more conclusive results. I would also have liked to travel to the area again, at different times of the year to prove the validity of my conclusions decisively.
One final possibility is to compare this honeypot site with another to compare the similarities and differences of two (or more) honeypot sites.
Bibliography
- A to Z of Betws-y-Coed - Donald Shaw
- Darganfod Exploring Betws-y-Coed - Betws-y-Coed Community Council
- Ordnance Survey Explorer Guide: Snowdonia and North Wales – AA
- Various Leaflets from the Betws-y-Coed Information Centre
-
Photographs taken by Paul Dunn and Danny Jardine on the 1st April 2003
- Gwynedd County Council Census Information - Information Sheet No. 4Learning To Live With Tourism (1988) - Bingham H.
- The Lake District National Park - A Fragile Environment