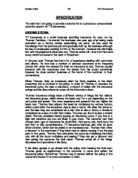
To produce my financial system I will use the following hardware and software:
Epson printer - to print out the finished quotation sheet.
Portable disk - to store the whole project. I do not have a printer at home, so I have to store my entire work to the memory stick and print out from my uncle’s office.
Microsoft Excel – I will use this programme to produce my financial system
MS Word- uses the spellchecker, in case my grammar contains any mistakes.
In term of collecting a data, I can find out the pervious quotation sheet that my dad did before. To find out the fix cost, I could ask my dad to get all the information. Therefore I do not need to worry about it. As far as I concern is to find out the basic cost, which is the material cost, labour cost and other basic cost. I could use the receipt that he bought the material or equipment for the project. For example, if he buys a dialling table in a company, he will receive a receipt for it. Therefore I could use those receipts to find out how much he has spent for this particularly project. It is quite hard to collect the entirely receipts, but my dad has promised me he will save the entire receipts for me. I could also look at my dad’s cheque record to ensure it gives a accurate result. Finally to find out the other information, my dad could help me with it. Hopefully, I could collect all the necessary information that is required for this financial system.
For this coursework, I have to type all the information on a computer and Microsoft Word is the software that I am going to represent my piece of coursework. Microsoft excel is the software that I am going to use, but not to represent the work. I will use the function which is called “screen shot” to copy all my work from Microsoft Excel to Word. Furthermore, my financial system will have to look good and not contain any mistakes. Therefore I will use the spellchecker in Word to spot any spelling mistakes and will proof read the text to spot any mistakes in my English. Alternatively, I could get my English teacher to double check, in case my sentences are not making any sense.
Manual System
Using a computer
It also can produce a graph on the computer.
- Automatically calculates the income
- Mistakes can be easy to modify
- Adding up the money will be more accurate
- Can produce a high quality graph
- Easy to control once you set up the whole system
- The security of the information is good, because people have to know the password to log on.
- People using this system will need more training with this system than the paper system.
- Hacking
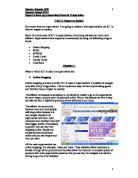
This is my second attempt:
I think my information is not very detail although I have added two more columns which are contact number and detail. I have added that because if my dad want to know what have he done for the project and the customers phone number, he could find out from the system. I should list more relevant information into the table, because if there is not enough information, it will produce an inaccurate result. I will try to improve it in my second version. Also, the pie chart is nothing relative to other information. In fact, the pie is probably not appropriate. This is because bar chart and pie chart are only show the discrete data, but not the continuous data. To produce a financial system, the data should be continuous. The last thing is that I should not use the actual date, because my dad does not need to know what exactly date is. .
I think this one is quite good. It contains some important information, such as month, year, received money, spent money and total income, but I think it is not good enough. The financial system needs to be very accurate, so I should be contained some other certain information. This information can link together and produce a graph, so I need to work on it a little more. The scatter graph is the best ideas to produce the graph, so I am not concern about the graph. I will improve those mistakes on my final version.
Key:
Fix cost - £1120 per month, £13440 per year, which is included everything, such as electricity and the other cost.
Profit Margin – 15% of the basic cost
Basic cost = Material cost + labour cost
Labour cost = £ 100 per person in a day. It depends on how many days they work for the project.
I am using scatter graph, because I think this is the best graph to show how much money did my dad makes and how many project has he done in a year.
Also I am going to produce a form that can show how much money my dad has spent and earned in every month.
I think my final version is the best one, because it contains all the necessary information, such as basic cost, fix cost, labour cost, income, profit…… The result of my graph would very pretty accurate, because it has included all the important information. If my dad can tell me the exactly number that he has spent for the material or the things, the financial system will give an accurate number that my dad has earned.
Test 1
The income should be higher than the basic cost, because my dad does not want to lose any money in a business. Therefore, the figure must not be minus.
Test 2
The total should be higher as it goes down each column, because the value should be acuminated as it goes down each column. The factor which influences the Total Profit is the Profit.
I could use this form to collect the data, because it much clearer and easier. I have to write down the data on the relevant column. In this form, I do not need to do any calculation. This is because Microsoft Excel can do all the calculation for me when I typed it in. The form contains all the necessary information that I need for the financial system.
Firstly, I open a blank page from Microsoft Excel, so it can let me to insert all the data.
After that, I have to type in all the information such as, fixed cost, profit margin and labour cost. This fix cost will not change, so I put it at the top of the pages. I think this is the easiest way to look at it.
Afterwards, I could type in the main information, for example, project no, name, fixed cost, month, working day, no of labour, labour cost, material and other cost, total basic cost, income, profit, total profit and actual income. That information is the main things that I am going to work on it.
The first column which is project 0, so all the things should be 0 such as, profit and total profit…… The only exception is the fixed cost; it should be £1120 per month.
Then, I insert all the data that I have collected from my collecting form. The next step is to fill up the all the blank column. I could use the formula to calculate the data, such as labour cost, total basic cost, income, profit, total profit and basic income.
To work out the labour cost, I have to use the formula which is,
Labour cost = the number of labour * the number of the working day * rate
For the first project, the number of working day is 3 and the number of labour is 3. The rate is always £100 per person per day. Therefore the formula should be 3*3*100 or D8*E8*100, which is £900.
The most impressive function in Microsoft Excel is that we do not need to work out each project. The quickly way to doing this is to select the number and drag it down. The function will follow the same formula to calculate the answer very quickly. Also, the good thing is when you change the number in the formula; the function will also calculate the new number automatically.
Subsequently, I have to find out the total basic cost. The way to doing this is to add another formula into the column, which is F8+G8 or 900+2514. The total basin cost is
The labour cost plus the material and other cost.
When I calculated the number, I could do the same way again.
The income, profit and total profit are using the same way, but the only exception is that the formula would be different with others. The formula for income, profit, total profit and actual income are following:
Income = Total basic cost *(1+ the profit margin which is 15%)
Profit = Income – Total basic cost
Total Profit = the pervious Total Profit + Profit
Actual income = Total Profit – fixed cost which is £13440
If I know the formula, I could be able to find out the result.
The next step is to produce a graph which shows a business line or the tendency of the profit. The graph will show two lines, one is for the fixed cost and the other one is for the profit line. Each line should be linked to 2 types of relevant information. The fixed cost lines which links to the project number and fixed cost. The profit line which links to the project number and total profit. I will produce the graph by using chart wizard in Microsoft Excel.
Scatter graph is the graph that I am going to use.
Then I add another series for next line which is the profit line.
Then I have to insert all the labels and title.
This is the final graph. It can clearly to show how many project my dad have done, which is 20. The critical point shows the point that my dad started to gain the money. Therefore, from project 1 to project 12, my dad still did not have any profit. He started to earn the money from project 12 to project 20.
The next graph is to show how much money did my dad actually makes. To produce this graph, I need to have 2 types of information, which are the number of the project and the actual income.
And again, I need to insert the label and title for the graph.
This is the final graph.
As I can see from the graph, my dad has made nearly £30000 in a year. If he only did 1 project in a year, he will lose roughly £13000. This is because he has to pay the fixed cost which is £13440 although he did not have any project. As the amount of project increase, the rate the money will also increase. My dad did not earn any money until he did 12 projects in a year. When he did 13 projects, he started to have a profit. The graph can clearly to show how much he has earned in a year and therefore it achieved my aim of my project. In case, my dad does not understand how my graph works. I will explain to him and I will produce a form to show how much he has earned or lost in a particularly month.
Result form
To make it easier for my dad, I am going to produce a result form to show how much money my dad has spent and the money he has actually earned in a month.
Then, I make a border for my form, because it will look much better.
Afterward, I start to insert my data. I can collect the data by using the collection form.
To find out the money my dad has spent on January, I could calculate the sum of the total basic cost, which is: 6044+7611+8121+9212. I could use this way to calculate the money my dad has spent on every month.
Then I am going to find out the profit that my dad has made in each month. To find out the profit, I could use the same way again. The only differ is this time I need to sum up the profit in each month and subtract the fixed cost which is £1120.
The last process is to find out the total profit. To find out the total profit, I could sum up the profit on each month.
From the form, I noticed my dad did not receive any project from Aug to Dec. As the result, it appears £ -1120 which is the fixed cost. I also know he has gained a lot of money on May. I think this form can clearly to show how much money my dad has spent and earned and I hope it would be useful for him.
I think the financial system is developed quite successfully and it would be useful for my Dad’s company.
In my ‘identification of problem’, I stated my objectives for the financial system were:
- To make sure the income form include all the necessary data, such as the price, the date and customer name……
Yes, I have achieved this. All the necessary are included in my financial system.
- To make sure the system contains two nice graphs
Yes, I have done that.
- To make sure all the figure can clearly to show on the result form
Yes I have done this.
4. To make sure the two graphs and the profit form look good
Yes, I have achieved this.
5. To make sure the financial system easy to understand
Yes, this is also achieved.
The things have gone well in my project was that I did not need to do any calculation, because all the calculation have been done by the Excel. As the result, it saved me a lot of time. Also, I am quite pleased with my graph which shows how many project my dad have done in every year and until when my dad started to make profit. I think this is quite important for a company.
There are some things which did not work very well was that the colour of the result form does not like professional at all. I used random colour for my result form, so some of the data did not list very clear. However, the form also achieves what I expected to do.
If I have an opportunity to redo it again, I will make the result looks more professional and use the actual data instead of every month. Because I think it will be more specific. Nevertheless, the financial form will be more complicate. Overall, I am quite pleased what I have done in this piece of coursework.