
Maths Coursework - The Open Box Problem
Maths Coursework - The Open Box Problem In this investigation we are asked to determine the size of the square cut out which makes the volume of the box as large as possible for any given rectangular sheet of card. This investigation is dived up into 2 parts; Part 1 and Part 2. Part 1 For this part we are asked to determine for any sized square sheet of card, investigate the size of the cut out square which makes an open box of the largest volume. Part 2 For this part we are asked to determine for any sized rectangular sheet of card, investigate the size of the cut out square which makes an open box of the largest volume. Part 1 I decided to construct a table to investigate what length of cut out would give the largest volume. This is the table I constructed for a 10 by 10 square using the program Microsoft Excel. 20 by 20 square Cut Out x Width 20-2x Length 20-2x Volume 8 8 324 2 6 6 512 3 4 4 588 4 2 2 576 5 0 0 500 6 8 8 384 7 6 6 252 8 4 4 28 9 2 2 36 0 0 0 0 I have now found out that in a 10 by 10 square the cut out which gives the largest volume is between 3 and 4 but more towards 3 since 3 gives a larger volume. To obtain a more accurate result I will zoom in the shaded region. Cut Out x Width 20-2x Length 20-2x Volume 3.1 3.8 3.8 590.364 3.2 3.6 3.6 591.872 3.3 3.4 3.4 592.548 3.4 3.2 3.2
In this assignment I have been given the task of; 'Investigate gradients of curves'
Introduction In this assignment I have been given the task of; 'Investigate gradients of curves' To accomplish this I hope to use graphs of different curves to acquire my data, which I will then tabulate and use to hopefully find a common rule for this assignment. There are three main types of line graphs and they are divided by order. Order 1 lines are called linear and have the equation 'y = ax + b'. Order 2 lines are called quadratic and have the equation 'y = ax + bx + c'. Order 3 lines are called cubic and have the equation 'y = ax + bx + cx + d'. I will be concentrating on order 2 line graphs. Prediction I predict that the rule will have something to do with the numbers before and after x in the curves' equation. Method Using the quadratic lines y = x , y = 2x , y = 3x , y = 4x , and y = 5x , I will plot these onto graph paper to get 5 curves. I will then work out the gradient at the points, x = 1, x = 2, x = 3, x = 4, and x = 5 on those graphs, using two integer points on a tangent parallel to the curve at the above points and the formula, 'y co-ordinate of B - y co-ordinate of A / x co-ordinate of B - x co-ordinate of A'. I will then tabulate all of those gradients, and from that table hopefully work out the common rule. Graphs On separate sheets. Results Curve x = 1 x = 2 x = 3 x = 4 x = 5 y = x 2 3.3 6

Analysing Triangle Vertices and Bisectors
Part 1 The diagram shows a triangle with vertices O(0,0), A(2,6) and B(12,6). The perpendicular bisectors of OA and AB meet a C. (a) In order to write down the perpendicular bisector of the line joining the points A(2,6) and B(12,6), I need to find the line's mid-point. The mid-point of the line joining P(x1, y1) to Q(x2, y2) has the co-ordinates ( ) So the co-ordinates of the midpoint of AB are ( ) = (7,6) As the two points A(2,6) and B(12,6) have the same y-value, the gradient of the line joining the points is 0. This means that the line's perpendicular bisector also has a gradient of 0. Thus the equation of the bisector is x = 7 (b) To find the equation of the perpendicular bisector of the line joining the points O (0,0) and A(2,6), I again need to find the co-ordinates of the mid-point of OA. The gradient, and hence that of the perpendicular bisector, can also be found. Thus, knowing the gradient of the perpendicular bisector and one point on it, I can use y - y1 = m(x - x1) (where m is the gradient) to obtain the required equation. Co-ordinates of the mid-point of OA are ( ) = (1,3) The gradient of the line joining the points O (0,0) and A(2,6) is a measure of the steepness of the line OA and it is the ratio of the change in the y co-ordinate to the change in the x co-ordinate in going from O to A. Thus, the gradient of OA = = = 3 If two lines
Numerical Integration Report
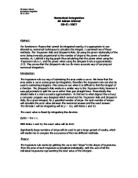
Numerical Integration Ali Adnan Ahmed 08-01-2007 Abstract: For functions in Physics that cannot be integrated exactly, it is appropriate to use alternative, numerical techniques to calculate the integral. I examined two of these methods. The Trapezium Rule and Simpson's Rule. By using the given relationship of the error being inversely proportional to the number of strips to the power of another number, m, I plotted a log-log graph thus calculating that the power when using the Trapezium rule is 1, and the power when using the Simpson's rule is approximately 3.75. This proves that the Simpson's rule is a far more accurate way of carrying out numerical integration. Introduction: The trapezium rule is a way of estimating the area under a curve. We know that the area under a curve is also given by integration, therefore the trapezium rule can also be used to estimating integrals. This comes in use when it is difficult to find the integral of a function. The Simpson's Rule works in a similar way to the Trapezium Rule; however it uses polynomials to split the curve rather than just straight lines. Theoretically this should make it a more accurate approximation. To find out to what degree this is true,I a computer program was designed which carried out the Trapezium Rule and Simpson's Rule, for a given integral, for a specified number of strips. For each number of strips i
What affects the speed of a moving vehicle?
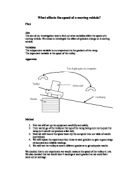
What affects the speed of a moving vehicle? Plan Aim The aim of our investigation was to find out what variables affect the speed of a moving vehicle. We chose to investigate the effect of gradient change on a moving vehicle. Variables The independent variable in our experiment is the gradient of the ramp. The dependant variable is the speed of the trolley. Apparatus Method . First we will set up the equipment carefully and safely. 2. Then we let go of the trolley at the top of the ramp, being sure not to push the ramp (or it would not produce a fair test). 3. Next we will record the speed taken by the computer into our table of results (see below). 4. We will repeat the experiment four times at each gradient to gain a good range of accurate and reliable readings. 5. We will test the trolley at seven different gradients to get adequate results. We decided that in our experiment we would measure the speed of the trolley in m/s. We also decided that we would take 4 readings at each gradient so we could later work out an average. We chose to use the computer to measure the speed as this was a more accurate method than timing it using a stop clock. We chose to use gradient intervals of five books as this would produce results that were more dramatic so would show a more obvious pattern. Fair test To ensure that our results were valid the following measures had
Investigating the Gradient of a Graph of theForm ‘y=x3’
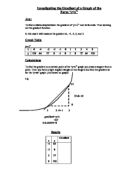
Investigating the Gradient of a Graph of the Form 'y=x3' Aim: To find a relationship between the gradient of 'y= x3' and its formula. Thus working out the gradient function. In this case I will measure the gradient at, -4, -2, 3, and 5. Graph Table y= x3 x -5 -4 -3 -2 -1 0 1 2 3 4 5 y 25 64 27 8 -1 0 1 8 27 64 125 Calculations To find the gradient on a certain point of the 'y=x3' graph you draw a tangent from a point. Then you form a right-angled triangle on the tangent and find the gradient as for the 'y=ax' graph. (As shown on graph) e.g. 27 27-8= 19 8 2 3-2= 1 3 gradient=y/x =3/1 GRADIENT=3 Results x y Gradient -4 -2 3 5 64 8 27 25 Conclusion From these results I can conclude that the gradient function for the graph 'y= x3' is 3x2. To test this result I can predict that the gradient at x=0.5, will be 0.75. * G = 3x2 * G = 3 x 0.52 * Gradient = 0.75 Results II X y gradient 0.5 0.125 Conclusion II This proves that the gradient function for the graph 'y= x3' is 3x2. However, I can also conclude that the method of using tangents to measure the gradient is too inaccurate to produce good results. Therefore, in my next investigation I will use the small increment
Investigating the Gradients of Graphs of the Form ‘y=ax’
Investigating the Gradients of Graphs of the Form 'y=ax' Aim To find a formula for the gradient of a 'y=ax' graph. To do this I will take a number of values of 'a' find the gradients and form a conclusion. Having done this I will test my theory with a different value of 'a'. The values of 'a' that I will test are: 1,2,3 and 5 Then a fraction and a negative number: 1/5 and -4. Calculations To find the gradient, I take a two points on the line and form a right-angled triangle off them, as shown on graph. Then I divide the height of the vertical side by the length of the horizontal, measuring from the axis, and take down the gradient. e.g. 7 7/3 = 3.5 gradient = 5 3 Graph Table a=1 x 0 1 2 3 4 5 6 7 8 9 10 y 0 1 2 3 4 5 6 7 8 9 10 a=2 x 0 1 2 3 4 5 6 7 8 9 10 y 0 2 4 6 8 10 12 14 16 18 20 a=3 x 0 1 2 3 4 5 6 7 8 9 10 y 0 3 6 9 12 15 18 21 24 27 30 a=5 x 0 1 2 3 4 5 6 7 8 9 10 y 0 5 10 15 20 25 30 35 40 45 50 a=1/5 x 0
Gradient Function
Gradient Function Mr. Bailey Adnan Sarayqum CA9 Plan I am aiming to find the relationship between the X values and the slopes/gradients from given points on a curve. The first graph I will use is for the equation Y=X2. I will choose a fixed point e.g. (2, 4), (4, 16). I can choose the values of X which can be negative numbers or positive numbers. I will find gradient from different points on the curve using my fixed points. I will choose a higher value and a lower value than my fixed point and move towards my fixed point. I will see how the gradient (change in y/change in x) changes as I move closer to my fixed point. I will see the relationship between my fixed point and the gradient and try to look for a formula. I will also use other equations, for example, Y=3X2, Y=X2 - 4 and Y=X3. Then I will look at my results tables and graphs and try to formulate a general formula for gradients. Y=X2 My first fixed point is 2, 4 x y change in y change in x gradient 3 3 .1 .21 2.79 0.9 3.1 .2 .44 2.56 0.8 3.2 .3 .69 2.31 0.7 3.3 .4 .96 2.04 0.6 3.4 .5 2.25 .75 0.5 3.5 .6 2.56 .44 0.4 3.6 .7 2.89 .11 0.3 3.7 .8 3.24 0.76 0.2 3.8 .9 3.61 0.39 0.1 3.9 .99 3.9601 0.0399 0.01 3.99 .999 3.996001 0.003999 0.001 3.999 2 4 2.001 4.004001 -0.004001 -0.001 4.001 2.01 4.0401 -0.0401 -0.01 4.01 2.1 4.41 -0.41
Gradient Function - To discover different curves and their relations, and the formula for the gradient.
Gradient Function Coursework Aim To discover different curves and their relations, and the formula for the gradient. What is a gradient? My understanding of a gradient is that it tells us how steep a slope is. The Oxford dictionary says '1 a sloping part of a road or railway. 2 the degree of a slope, expressed as change of height divided by distance travelled. 3 Physics a change in the magnitude of a property (e.g. temperature) observed in passing from one point or moment to another.'. How will I find the gradient? I will find the gradient by using two methods; the tangent method and the increment method. The tangent method involves drawing a right angled triangle with the hypotenuse touching the point you want to find the gradient of, and stretching to the two other corners. See the graph 'Tangent Method' . On this graph we see four letters, D being that of the point and A, B and C being of the triangle. Now to find the gradient with this method we do BC÷AC. The increment method, which we use as it is more accurate than the tangent one. You zoom into the graph and take the x point and y point just after a whole figure. For instance with y-x2 , using point (1,1) we would do 1.0012 - 1 for the y value and 1.001 - 1 for the x value. So therefore - Method = 0.002001 / 0.001 = 2.001, which we can say is roughly 2. Y=X Please see graph y=x As the co-ordinates are

Gradient Function Maths Investigation
Gradient Function My task My task is to investigate the relationship between the gradients of tangents on the curves of graphs when y=axn Where a is a constant and is not 0, n is equal to 0, 1, 2, 3......... Definition Gradient of the curve between x1 and x2 is defined as: When x2 is getting close to x1 the gradient becomes the gradient of the curve at x1. The gradient to a curve, at a particular point, is given by the gradient of the tangent to the curve at that point. Method . I will draw the curves, y=2x2 and y=ax2 by hand on 5mm graph papers. Next I will draw the tangents and find the gradient of the tangents on the curve when x= -3, -2, -1, 0, 1, 2, 3. 2. I will then use the small increment method, where I use a small increment ?x=0.001. For x= -3, -2, -1, 0, 1, 2, 3 I will find the gradient between x and x+?x by substituting it into the formula, and find ?y/?x. Results and observations By method 1 I started off with y=x2 See Graph 1 x -3 -2 -1 0 2 3 gradient of curve -6 -4 -2 0 2 4.27 6.36 Observation: I noticed that the gradient of the curve is approximately 2 times the value of x. Then I looked at the curve y=ax2. See graph 2 x -3 -2 -1 0 2 3 Gradient of curve -6a -4a -2a 0 2a 4a 6a Observations: Everything is times a because it is a constant. I have noticed that the gradient of y=ax2 is always 2ax. The gradient of y=ax2