
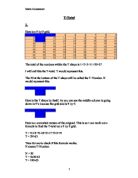
T shapes. Once I have all of the results, I shall work out the nth term and investigate the relationship between the T number and the T total.
Explanation for task 1. I am going to draw several T shapes on a 9 by 9 number grid and get the total of the numbers inside the T shape, which is called the T total, get the T number, which is the bottom number in the T shape and note them down in a table of results. I will repeat this a few times and note down the other results I get in the same table. Once I have all of the results, I shall work out the nth term and investigate the relationship between the T number and the T total. 2 3 4 5 6 7 8 9 0 1 2 3 4 5 6 7 8 9 20 21 22 23 24 25 26 27 28 29 30 31 32 33 34 35 36 37 38 39 40 41 42 43 44 45 46 47 48 49 50 51 52 53 54 55 56 57 58 59 60 61 62 63 64 65 66 67 68 69 70 71 72 73 74 75 76 77 78 79 80 81 2 3 4 5 6 7 8 9 0 1 2 3 4 5 6 7 8 9 20 21 22 23 24 25 26 27 28 29 30 31 32 33 34 35 36 37 38 39 40 41 42 43 44 45 46 47 48 49 50 51 52 53 54 55 56 57 58 59 60 61 62 63 64 65 66 67 68 69 70 71 72 73 74 75 76 77 78 79 80 81 2 3 4 5 6 7 8 9 0 1 2 3 4 5 6 7 8 9 20 21 22 23 24 25 26 27 28 29 30 31 32 33 34 35 36 37 38 39 40 41 42 43 44 45 46 47 48 49 50 51 52 53 54 55 56 57 58 59 60 61 62 63 64 65 66 67 68 69 70 71 72 73 74 75 76 77 78 79 80 81

Maths Investigation : The relationship between the base number and the T-number
Introduction For my course-work investigation I will be working out the relationship between the base number and the T-number. I will also be including two variables into my investigation to see how it can change the relationship between base number and T-number. 2 3 4 5 6 7 8 9 0 1 2 3 4 5 6 7 8 9 20 21 22 23 24 25 26 27 28 29 30 31 31 33 34 35 36 37 38 39 40 41 41 42 44 43 45 47 48 49 50 51 52 53 54 55 56 57 58 59 60 To find out the formula and relationship I must firstly see if there is a pattern between one T-shape and another and any other patterns that could help me find the formula. I will also be displaying my work in graphs and tables. Number 1: 2 3 4 5 6 7 8 9 0 1 2 3 4 5 6 7 8 9 20 21 22 23 24 25 26 27 28 29 30 31 31 33 34 35 36 37 38 39 40 41 41 42 44 43 45 47 48 49 50 51 52 53 54 55 56 57 58 59 60 The first T-shape I have indicated in red. The base number is 22 and the T-Number is 40 Base Number = 22 T-Number = 40 Number 2: 2 3 4 5 6 7 8 9 0 1 2 3 4 5 6 7 8 9 20 21 22 23 24 25 26 27 28 29 30 31 31 33 34 35 36 37 38 39 40 41 41 42 44 43 45 47 48 49 50 51 52 53 54 55 56 57 58 59 60 Base Number = 23 T-Number = 45 Number 3: 2 3 4 5 6 7 8 9 0 1 2 3 4 5 6 7 8 9 20
T-Total. I can work out a formula to find the T-total on a 9 by 9 grid.
T-Total . Here is a 9 by 9 grid. 2 3 4 5 6 7 8 9 0 1 2 3 4 5 6 7 8 9 20 21 22 23 24 25 26 27 28 29 30 31 32 33 34 35 36 37 38 39 40 41 42 43 44 45 46 47 48 49 50 51 52 53 54 55 56 57 58 59 60 61 62 63 64 65 66 67 68 69 70 71 72 73 74 75 76 77 78 79 80 81 The total of the numbers within the T shape is 1+2+3+11+20=37 I will call this the T-total. T would represent this. The 20 at the bottom of the T shape will be called the T-Number. N would represent this. 2 3 1 20 Here is the T shape by itself. As you can see the middle column is going down in 9's because the grid size is 9 by 9. N-19 N-18 N-17 N-9 N Here is a converted version of the original. This is so I can work out a formula to find the T-total on a 9 by 9 grid. T = N-19+N-18+N-17+N-9+N T = 5N-63 Time for me to check if this formula works: N means T-Number. N = 20 T = 5x20-63 T = 100-63 T = 37 To make sure it is not a fluke, I will do 2 more checks on the same grid size. 6 7 8 26 35 T = 112 T = 5x35-63 T = 175-63 T = 112 48 49 50 58 67 T = 272 T = 5x67-63 T = 335-63 T = 272 So now you know the formula for the 9 by 9 grid is T =5N-63 2. I will now find the formula for a 5 by 5 grid. Here is the 5 by 5 grid. 2 3 4 5 6 7 8 9 0 1 2 3 4 5 6 7 8 9 20 21 22 23 24 25 The total

For this task we were required to create a model that can be used to economise on my quarterly household electricity bill.
Coursework modelling 1B - Write Up For this task we were required to create a model that can be used to economise on my quarterly household electricity bill. My family quarterly electricity bill may be too high. I need to try and devise a method to bring the bill down to an acceptable level. There are lots of aspects of an electricity model that need to be known. Some of the important ones are: * Unit- these are kilowatt-hours, which are the amount of hours an appliance uses multiplied by the kilowatts the appliance has. * Tariff- the rate at which a company charges a unit. * Two-tier tariff- this can also be called a split rate. There are two different costs per unit. There is usually a cost for the first units up to a certain value, sometimes known as a split value, and a different cost per unit for any units after the split value. My bill uses a two-tier tariff. I have named it a split rate model throughout this write - up. * Value added tax (VAT)- this is usually a percentage and is added on to a price. * Standing charge- a value of money that is added onto a price. It is normally a value without percentages, and is added on to a price just for using a supplier. There are many different types of bills. The bills are usually paid quarterly. There is a standard model, which is simply calculated by multiplying the unit amount by the cost per unit. A unit can also
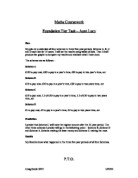
Aunt Lucy Maths Investigation
Maths Coursework Foundation Tier Task - Aunt Lucy Plan My plan is to calculate all four schemes in three five-year periods. Scheme A, B, C and D each last for 15 years. I will set the results using tables of data. Then I shall produce bar graphs to compare my results and evaluate what I have done. The schemes are as follows: - Scheme A £100 to pay now, £90 to pay in a year's time, £80 to pay in two year's time, ect Scheme B £10 to pay now, £20 to pay in a year's time, £30 to pay in two years time, ect Scheme C £10 to pay now, 1.5 of £10 to pay in a year's time, 1.5 of £10 to pay in two years time, ect Scheme D £1 to pay now, £2 to pay in a year's time, £4 to pay in two years time, ect Prediction I predict that Scheme C will have the highest income after the 15-year period. The other three schemes I predict will go in the following order: - Scheme B, Scheme D and Scheme A. Scheme making the least money and Scheme C making the most. Results My Results show what happened in the three five year periods of all four Schemes. P.T.O. Scheme A Years 1 - 5 Number of Years Annual Scheme Income Total £100 £100 2 £90 £190 3 £80 £270 4 £70 £340 5 £60 £400 Scheme A Years 6 - 10 Number of Years Annual Scheme Income Total 6 £50 £450 7 £40 £490 8 £30 £520 9 £20 £540 0 £10 £550 Scheme A Years 11 - 15

Given a 10 x 10 table, and a 3 steps stair case, I tried to investigate any relation between the two. I started doing this, by positioning the staircase so that the bottom left number would be one
AIM: FOR OTHER 3-STEP STAIRS, INVESTIGATE THE RELATIONSHIP BETWEEN THE STARE TOTAL AND THE POSITION OF THE STAIR SHAPE ON THE GRID Given a 10 x 10 table, and a 3 steps stair case, I tried to investigate any relation between the two. I started doing this, by positioning the staircase so that the bottom left number would be one and calculating the sum of all the numbers inside it, after this I moved the stair case one step to the right for a few times, and calculated the totals each time I moved it. These are the results: Bottom left number Total sum 50 2 56 3 62 4 . . 68 . . So, each time I move by one square on the right the stair case, I noticed that: * All the numbers were even numbers; * Six is added each time to the next number; * The sequence doesn't start with one. So I discovered that a sequence was created. But, to use this sequence I had to find a formula which by knowing the bottom left number (this number has to be in the first row) of the staircase I could work out the total. To do this, I used an nth term formula. 44 50, 56, 62, 68, ... The first part of it is 6n as the number six is added each time. Whilst the second pat of the formula is +44, because, as the sequence doesn't start with one, I have to do the inverse operation by subtracting 6 from the first number of the sequence going one step backwards. And this gives the final
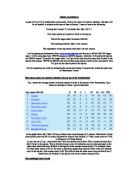
Maths Statistics on premiership football.
Maths coursework As part of my G.C.S.E mathematics coursework, I had to do a piece of work on statistics. My topic will be on football in relation to this area of data collection. I want to look at the following: Proving that Arsenal F.C are better than Man Utd F.C How many points are needed to finish in the top ten Predict the league table for season 2003/04 Past meetings between Man U and Arsenal The importance of the top scorers from Man Utd and Arsenal I will be getting my information from www.soccer-stats.com and the o.p.t.a official 2001/02 league stats. I will be using data from 1995/96 seasons to 2002/03 seasons. After this I will predict the top ten for 2004/05 season. To predict the league table I will put all the data from the teams that finished in the top ten from season 1995/96 to 2002/03 and find out their mean points over the seven year period. This will give me the data to predict the top ten. I will be expanding my work by comparing the points and seeing if Arsenal have closed the point race on Manchester United. How many points are needed to finish in the top ten of the Premiership? Fig 1 shows the average amount of points needed to finish in the top ten of the Premiership. Fig 2 shows an example of where I got the data from. Fig 2 season 2001/02 Pl W D L GF GA GD
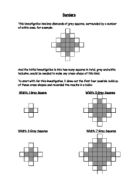
Borders - Investigation into how many squares in total, grey and white inclusive, would be needed to make any cross-shape of this kind
Borders This investigation involves diamonds of grey squares, surrounded by a number of white ones, for example: And the initial investigation is into how many squares in total, grey and white inclusive, would be needed to make any cross-shape of this kind. To start with for this investigation, I drew out the first four possible build up of these cross-shapes and recorded the results in a table: Width: 1 Grey Square Width: 5 Grey Squares Width: 3 Grey Squares Width: 7 Grey Squares Width / Grey Total / Shaded Total / White Total / All 4 5 3 5 8 3 5 3 2 25 7 25 6 41 This table shows there is a relationship between each of the set of numbers produced. As the width increases by two each time, letting the width = n means that: N1 = 1, N2 = 3, N3 = 5 and N4 = 7 This relation between which term applies to a width can be shown as: Nno. = Width + 0.5 2 From hereon, each suffix will have been derived from the width of shaded squares, in the way mentioned above. Next, looking at the increases between the totals of both shaded and white squares, an equation can be found to express in terms of N the total number of squares, inclusive. 5 13 25 41 8 12 16 4 4 This shows there is a relation, and the formula produced will be a
Using Formulas In Microsoft Excel.
Using Formulas In Microsoft Excel Through using Microsoft Excel, I had completed a chart of Ten names, Age and shoe sizes. When working out the Total, Average, Highest and the lowest I used specific formulas, which worked out the exact answer. Below I will start to show you what I needed to do to complete this table and how the formulas helped me to discover the answer. But first you may wonder, why do we need to use formulas? It is a simple procedure in which you have to complete into an in depth and detailed formula before it can respond, whilst calculating to give you the accurate answer. Formula has a vast majority of definitions the one in which, I'd put is that it is a mathematical rule expressed in figures. Total: ~ This calculated the sum of two numbers together to give me the answer that I would need to include on the table. =SUM (B2:B11) Average: ~ a result obtained by adding several amounts together and then dividing the number of different amounts, but on excel you have simple procedures to follow to allow you to calculate this by simply typing in a formula. =AVERAGE (B2:B11) Highest: ~The highest number in which you need to calculate by formulas to give you the correct answer that you are looking for. =MAX (B2:B11) Lowest: ~ The lowest number is found by typing in a simple formula, which

T-Totals - All the things T said
Chan-woo Kim Mathematics coursework T-Totals - All the things T said -Word definition *T-Total eg) 2 3 4 5 6 7 8 9 0 1 2 3 4 5 6 7 8 9 20 21 22 23 24 25 Looking at T-shape drawn on 5 by 5 number grid. The sum of the numbers inside the shape is 1+2+3+7+12=25 25 is called 'T-Total'. *T-Number The number at the bottom of the shape (the number which is shown by the shaded square) is called 'T-Number'. The T-Number for the T-shape above is 12. -The aim of this project is to investigate the relationship between T-Total and T-Number. -I use 9 by 9 number grid to investigate the relationship. 2 3 4 5 6 7 8 9 0 1 2 3 4 5 6 7 8 9 20 21 22 23 24 25 26 27 28 29 30 31 32 33 34 35 36 37 38 39 40 41 42 43 44 45 46 47 48 49 50 51 52 53 54 55 56 57 58 59 60 61 62 63 64 65 66 67 68 69 70 71 72 73 74 75 76 77 78 79 80 81 -Then I pick some samples to find what I am going to find. Sample 1) 2 3 1 20 T-Number = 20 T-Total = 1+2+3+11+20 = 37 Sample 2) 2 3 4 2 21 T-Number = 21 T-Total = 2+3+4+12+21 = 42 Sample 3) 3 4 5 3 22 T-Number = 22 T-Total = 3+4+5+13+22 = 47 -I arrange these samples in the table. T-Number 20 21 22 T-Total 37 42 47 -As we notice, when T-Number increases by 1, its T-Total also increases by 5. It shows that there is a certain