I am going to investigate how changing the number of tiles at the centre of a pattern, will affect the number of border tiles I
Contents Page 1 ~ Introduction Page 2 ~ Patterns for 2 centre tiles Page 5 ~ Patterns for 3 centre tiles Page 8 ~ Patterns for 4 centre tiles Page 11 ~ Patterns for 5 centre tiles Page 14 ~ Summary for patterns with a single row of centre tiles Page 16 ~ Patterns for 4 centre tiles Page 19 ~ Patterns for 6 centre tiles Page 22 ~ Patterns for 8 centre tiles Page 25 ~ Patterns for 10 centre tiles Page 28 ~ Summary for pattern with a double row of centre tiles Page 30 ~ Summary for single and double rows of tiles Page 31 ~ Patterns for 6 centre tiles Page 34 ~ Patterns for 9 centre tiles Page 37 ~ Patterns for 12 centre tiles Page 40 ~ Patterns for 15 centre tiles Page 43 ~ Summary for patterns with a triple row of centre tiles Page 44 ~ Conclusion Borders Coursework Introduction For my experiment I am going to investigate how changing the number of tiles at the centre of a pattern, will affect the number of border tiles I will need. I will do this to find patterns and a formula, to link back to each set of patterns. Each formula will be tested by using a larger border, but with the same number of centre tiles, this will ensure my formula is correct. I will then try to find a general formula, that will enable me to predict the border for any size centre tiles. I will also do the same for the total tiles in the pattern. Key N ~ Pattern B ~ Outer border
The T-Total Mathematics Coursework Task.
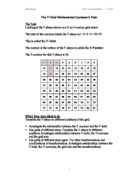
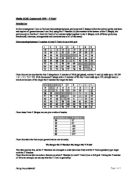
The T-Total Mathematics Coursework Task The Task Looking at the T-shape drawn on a 9 by 9 number grid below. The total of the numbers inside the T-shape is 1+2+3+11+20=37 This is called the T-Total. The number at the bottom of the T-shape is called the T-Number. The T-number for this T-shape is 20. 2 3 4 5 6 7 8 9 0 1 2 3 4 5 6 7 8 9 20 21 22 23 24 25 26 27 28 29 30 31 32 33 34 35 36 37 38 39 40 41 42 43 44 45 46 47 48 49 50 51 52 53 54 55 56 57 58 59 60 61 62 63 64 65 66 67 68 69 70 71 72 73 74 75 76 77 78 79 80 81 What I have been asked to do Translate the T-shape to different positions of the grid. * Investigate the relationship between the T-number and the T-total * Use grids of different sizes. Translate the T-shape to different positions. Investigate relationships between T-total, the T-numbers and the grid size. * Use grids of different sizes again. Try other transformations and combinations of transformations. Investigate relationships between the T-total, the T-numbers, the grid size and the transformations. The Method I have chosen I will follow my plan below while following the task and customizing it to achieve maximum marks. * I will first draw out one or two 9 by 9 number grids. Then I will fill in T-shapes until I see a pattern, each shape will be in a different colour
Investigating the links between the T-number and the T-total on a size 9 grid
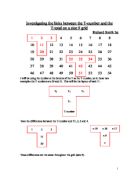
Investigating the links between the T-number and the T-total on a size 9 grid Richard Smith 5? 2 3 4 5 6 7 8 9 0 1 2 3 4 5 6 7 8 9 20 21 22 23 24 25 26 27 28 29 30 31 32 33 34 35 36 37 38 39 40 41 42 43 44 45 46 47 48 49 50 51 52 53 54 I will be using the number at the bottom of the T as the T-number, so in these two examples the T-numbers are 20 and 51. This will be the layout of each T: - T2 T3 T4 T1 T-number Take the differences between the T-number and T1, 2, 3 and 4. n-19 n-18 n-17 n-9 n 2 3 1 20 These differences are the same throughout the grid (size 9). Examples n-19 n-18 n-17 n-9 n 32 33 34 42 51 n-19 n-18 n-17 n-9 n 6 7 8 26 35 If you take all the differences, which add up to be -63 and take that from 5 (the amount of numbers in one T) multiplied by the T-number, it gives you the T-total. Here is the formula: - 5n-63=T-total I will now test this formula using some of the T shapes above. 6 7 8 26 35 2 3 1 20 32 33 34 42 51 5n-63 = T-total 5(20)-63 = T-total 37 = T-total Also: + 2 + 3 + 11 +20 = 37 5n-63 = T-total 5(51)-63 = T-total 92 = T-total Also: 32 + 33 + 34 + 42 + 51 = 192 5n-63 = T-total 5(35)-63 = T-total 12 = T-total Also: 6 + 17 + 18 + 26 + 35 = 112 As I have proved, the formula is correct for the T shape in a grid size of 9.
T totals. In this investigation I aim to find out relationships between grid sizes and T shapes within the relative grids, and state and explain all generalizations I can find
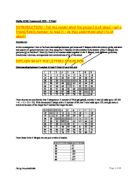
Maths GCSE Coursework 2000 - T-Total INTRODUCTION - Tell the reader what the project is all about - get a friend/family member to read it - do they understand what it's all about? Introduction In this investigation I aim to find out relationships between grid sizes and T shapes within the relative grids, and state and explain all generalizations I can find, using the T-Number (x) (the number at the bottom of the T-Shape), the grid size (g) to find the T-Total (t) (Total of all number added together in the T-Shape), with different grid sizes, translations, rotations, enlargements and combinations of all of the stated. EXPLAIN WHAT THE LETTERS STAND FOR Relations ships between T-number (x) and T-Total (t) on a 9x9 grid 2 3 4 5 6 7 8 9 0 1 2 3 4 5 6 7 8 9 20 21 22 23 24 25 26 27 28 29 30 31 32 33 34 35 36 37 38 39 40 41 42 43 44 45 46 47 48 49 50 51 52 53 54 55 56 57 58 59 60 61 62 63 64 65 66 67 68 69 70 71 72 73 74 75 76 77 78 79 80 81 From this we can see that the first T shape has a T number of 50 (highlighted), and the T-total (t) adds up to 187 (50 + 41 + 31 + 32 + 33). With the second T shape with a T number of 80, the T-total adds up to 337, straight away a trend can be seen of the larger the T number the larger the total. 2 3 4 5 6 7 8 9 0 1 2 3 4 5 6 7 8 9 20 21

Maths GCSE Coursework – T-Total
Maths GCSE Coursework 2000 - T-Total Introduction In this investigation I aim to find out relationships between grid sizes and T shapes within the relative grids, and state and explain all generalizations I can find, using the T-Number (x) (the number at the bottom of the T-Shape), the grid size (g) to find the T-Total (t) (Total of all number added together in the T-Shape), with different grid sizes, translations, rotations, enlargements and combinations of all of the stated. Relations ships between T-number (x) and T-Total (t) on a 9x9 grid 2 3 4 5 6 7 8 9 0 1 2 3 4 5 6 7 8 9 20 21 22 23 24 25 26 27 28 29 30 31 32 33 34 35 36 37 38 39 40 41 42 43 44 45 46 47 48 49 50 51 52 53 54 55 56 57 58 59 60 61 62 63 64 65 66 67 68 69 70 71 72 73 74 75 76 77 78 79 80 81 From this we can see that the first T shape has a T number of 50 (highlighted), and the T-total (t) adds up to 187 (50 + 41 + 31 + 32 + 33). With the second T shape with a T number of 80, the T-total adds up to 337, straight away a trend can be seen of the larger the T number the larger the total. 2 3 4 5 6 7 8 9 0 1 2 3 4 5 6 7 8 9 20 21 22 23 24 25 26 27 28 29 30 31 32 33 34 35 36 37 38 39 40 41 42 43 44 45 46 47 48 49 50 51 52 53 54 55 56 57 58 59 60 61 62 63 64 65 66
T-Total Investigation
Maths GCSE Coursework 2000 - T-Total Introduction In this investigation I aim to find out relationships between grid sizes and T shapes within the relative grids, and state and explain all generalizations I can find, using the T-Number (x) (the number at the bottom of the T-Shape), the grid size (g) to find the T-Total (t) (Total of all number added together in the T-Shape), with different grid sizes, translations, rotations, enlargements and combinations of all of the stated. Relations ships between T-number (x) and T-Total (t) on a 9x9 grid 2 3 4 5 6 7 8 9 0 1 2 3 4 5 6 7 8 9 20 21 22 23 24 25 26 27 28 29 30 31 32 33 34 35 36 37 38 39 40 41 42 43 44 45 46 47 48 49 50 51 52 53 54 55 56 57 58 59 60 61 62 63 64 65 66 67 68 69 70 71 72 73 74 75 76 77 78 79 80 81 From this we can see that the first T shape has a T number of 50 (highlighted), and the T-total (t) adds up to 187 (50 + 41 + 31 + 32 + 33). With the second T shape with a T number of 80, the T-total adds up to 337, straight away a trend can be seen of the larger the T number the larger the total. 2 3 4 5 6 7 8 9 0 1 2 3 4 5 6 7 8 9 20 21 22 23 24 25 26 27 28 29 30 31 32 33 34 35 36 37 38 39 40 41 42 43 44 45 46 47 48 49 50 51 52 53 54 55 56 57 58 59 60 61 62 63 64 65 66

T-Total.I aim to find out relationships between grid sizes and T shapes within the relative grids, and state and explain all generalizations I can find,
BRS Maths GCSE- T-Total Introduction In this investigation I aim to find out relationships between grid sizes and T shapes within the relative grids, and state and explain all generalizations I can find, using the T-Number (x) (the number at the bottom of the T-Shape), the grid size (g) to find the T-Total (t) (Total of all number added together in the T-Shape), with different grid sizes, translations, rotations, enlargements and combinations of all of the stated. Relations ships between T-number (x) and T-Total (t) on a 9x9 grid 2 3 4 5 6 7 8 9 0 1 2 3 4 5 6 7 8 9 20 21 22 23 24 25 26 27 28 29 30 31 32 33 34 35 36 37 38 39 40 41 42 43 44 45 46 47 48 49 50 51 52 53 54 55 56 57 58 59 60 61 62 63 64 65 66 67 68 69 70 71 72 73 74 75 76 77 78 79 80 81 From this we can see that the first T shape has a T number of 50 (highlighted), and the T-total (t) adds up to 187 (50 + 41 + 31 + 32 + 33). With the second T shape with a T number of 80, the T-total adds up to 337, straight away a trend can be seen of the larger the T number the larger the total. 2 3 4 5 6 7 8 9 0 1 2 3 4 5 6 7 8 9 20 21 22 23 24 25 26 27 28 29 30 31 32 33 34 35 36 37 38 39 40 41 42 43 44 45 46 47 48 49 50 51 52 53 54 55 56 57 58 59 60 61 62 63 64 65 66 67 68 69
T-Shapes Coursework
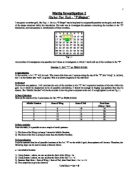
Maths Investigation 2 Higher Tier Task - "T Shapes" I was given a number grid, like Fig 1.1. On it, a "T Shape" was to be placed in any possible position on the grid, such that all of the shape remained within the boundaries. The task was to investigate the patterns connecting the numbers in the "T" themselves, and also patterns in combinations of these numbers. 2 3 4 5 6 7 8 9 0 1 2 3 4 5 6 7 8 9 20 21 22 23 24 25 26 27 28 29 30 31 32 33 34 35 36 37 38 39 40 41 42 43 44 45 46 47 48 49 50 51 52 53 54 55 56 57 58 59 60 61 62 63 64 Fig 1.1 Any number of investigations was possible, but I chose an investigation in which I would add up all the numbers in the "T". Section 1: 3x1 "T" on Width 8 Grid ) Introduction In this section, a 3x1 "T" will be used. This means that there are 3 squares along the top of the "T" (the "wing", in yellow), and 1 on the bottom (the "tail", in green). This is as shown originally in the task brief. 2) Method To discover any patterns, I will calculate the sum of the numbers in the "T" for 5 sequential locations of the box within the grid. As it would be impractical to do all possible calculations, 5 should be enough to display any patterns that may lie therein. The "Middle Number" will be the number in the wing that is adjacent to the tail. It is highlighted in red on Fig 1.1. 3)

For this task we were required to create a model that can be used to economise on my quarterly household electricity bill.
Coursework modelling 1B - Write Up For this task we were required to create a model that can be used to economise on my quarterly household electricity bill. My family quarterly electricity bill may be too high. I need to try and devise a method to bring the bill down to an acceptable level. There are lots of aspects of an electricity model that need to be known. Some of the important ones are: * Unit- these are kilowatt-hours, which are the amount of hours an appliance uses multiplied by the kilowatts the appliance has. * Tariff- the rate at which a company charges a unit. * Two-tier tariff- this can also be called a split rate. There are two different costs per unit. There is usually a cost for the first units up to a certain value, sometimes known as a split value, and a different cost per unit for any units after the split value. My bill uses a two-tier tariff. I have named it a split rate model throughout this write - up. * Value added tax (VAT)- this is usually a percentage and is added on to a price. * Standing charge- a value of money that is added onto a price. It is normally a value without percentages, and is added on to a price just for using a supplier. There are many different types of bills. The bills are usually paid quarterly. There is a standard model, which is simply calculated by multiplying the unit amount by the cost per unit. A unit can also

Objectives Investigate the relationship between the t-totals and t-numbers. To translate the t-shape to different parts of the grid.
Objectives * Investigate the relationship between the t-totals and t-numbers. * To translate the t-shape to different parts of the grid. Description I am going to look at the relationship between the T-number and the T-totals I will translate the t-shape into different positions on different grids, I will be making 3 different grids, 8x8, 9x9, 10x10, I will rotate the t-shape, translate it horizontally and vertically and work out a formula to all the transformations, I will also rotate the T-shapes and work out algebraic formulas for finding the T-totals of rotated T-shapes I will then write an analysis of my results, and lastly a conclusion. Grids I will start with an 8x8 grid size 2 3 4 5 6 7 8 9 0 1 2 3 4 5 6 7 8 9 20 21 22 23 24 25 26 27 28 29 30 31 32 33 34 35 36 37 38 39 40 41 42 43 44 45 46 47 48 49 50 51 52 53 54 55 56 57 58 59 60 61 62 63 64 Translate Horizontally I will start by calculating the T-total of the T-shapes, so I will be able to work out the difference between the three of them. I will be translating to the right. The T-totals for these 3 T-shapes are as follows: * T 18 1 2 3 10 18 +2+3+10+18=34 * T19 2 3 4 11 19 2+3+4+11+19=39 * T20 3 4 5 12 20 3+4+5+12+20=44 Table of results T-shape T-total Increment T18 34 +5 T19 39 +5 T20 44 +5 T-totals of