GCSE Maths Handling Data Coursework - Comparing Newspapers
Introduction
'The Times' newspaper is universally accepted as Britain's national newspaper. I have been asked to investigate the concerns of the editor that the sales are lower in comparison with the tabloids. I am going to investigate the lengths of the words, how many words there are in a sentence and the reading age if those who read the newspapers.
Hypothesis 1
I hypothesise that the world length for the broadsheet newspapers will be higher than that of the tabloid newspapers.
Broadsheet newspapers have longer words than the tabloid papers on average, because they are aimed at an older, more intelligent audience. In addition, broadsheets have longer articles and more statistics, graphs etc. This may attract the attention of a more intellectual audience.
Hypothesis 2
I hypothesise that the number of words in a sentence will be higher in the broadsheet newspapers than in the tabloid newspapers.
Broadsheet newspapers have a more complex sentence structure than the tabloid papers; this made me predict that words in a sentence would be higher in a broadsheet.
Hypothesis 3
I hypothesise that the reading age for readers of broadsheet newspapers will be higher than that of readers of tabloid newspapers.
Broadsheets are aimed at a higher reading age because of all the reasons above in the hypotheses.
Method
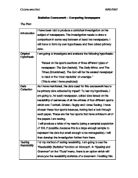
Firstly, I am going to collect four newspapers from the same day, two tabloids and two broadsheets. The tabloids I am going to use are 'The Sun' and 'The Daily Mirror'; the broadsheets I am going to use are 'The Times' and 'The Daily Telegraph'. By choosing two broadsheets and two tabloids, I have ensured that I have use d a fair amount, as this will help me get the most accurate results. Also, as I have bought the newspapers on the same day, the articles included in the newspapers will have the same headlines story - not word by word, but in general. This will also ensure that what I have done is fair and accurate.
After I have collected all the newspapers, the question is how many samples shall I take? How will I choose my articles? Obviously, I can't check every article in every newspaper, there isn't enough time so I have decided to take a sample of 100 words from each article to investigate the word length (see hypothesis 1). 100 words is a good amount to choose because it isn't too much and isn't too little - just right. Then the question is how am I going to choose this sample. Originally I was going to choose two articles from each newspaper, one sports article and one front page article, but I found out I didn't have enough time. If I had done this, it would have made my results even more accurate. I have now decided to choose one sample from each of the four newspapers randomly. I'm going to count the number of pages in each newspaper, then enter the number in a calculator and press the button then the hash button. The calculator will then choose the number for me and by using this process, I have eliminated bias (another way which I can eliminate bias is my buying all the newspapers on the same day, as I mentioned above).
When I have chosen the page number and located the article, I will start form the beginning ignoring pictures. This is because pictures aren't really part of the article. An article consists of words only, pictures aren't words, and therefore they are not part of the article. Pictures aren't the only things I'm going to ignore, I'm also going to ignore quotes, people's names and numbers, which are written in digits. I am choosing not to include numbers because the editor of 'The Times' clearly states that I have been asked to investigate 'word length', not numbers. I ...
This is a preview of the whole essay
When I have chosen the page number and located the article, I will start form the beginning ignoring pictures. This is because pictures aren't really part of the article. An article consists of words only, pictures aren't words, and therefore they are not part of the article. Pictures aren't the only things I'm going to ignore, I'm also going to ignore quotes, people's names and numbers, which are written in digits. I am choosing not to include numbers because the editor of 'The Times' clearly states that I have been asked to investigate 'word length', not numbers. I am not choosing people's names due to the fact that tabloids and broadsheets may use different names for the same people therefore making it an unfair investigation. For example, tabloids may call David Beckham, Becks and broadsheets may name David by his full name. When, in articles, the author puts in quotes they are writing down what the person said and they are not really part of the article. It would be better and more accurate to not include quotes because the four newspapers may all have different quotes and it may vary greatly thus making it inaccurate. I am going to count hyphenated words such as prime-time as two words, this is because they look like two separate words and when the reader reads it, they say it as two words. In addition, words with apostrophes I'm going count as one word because that's what an apostrophe is for.
I will count 100 words from the beginning excluding the word (and numbers) I have mentioned above. I will draw out 4 tally charts for each of the newspaper I am sampling. The tally chart will consist of 2 columns, one word length then the tally. The word length column will go all the way from 1 to 13, if when I count the word length I come across a word more than 13 letters I will add another row on the tally chart. Tally charts are an easy way to record findings because it's easy to just draw a small line in a column and they are easy to read.
After doing all this, I will use my mathematical skills which I will discuss later.
For my second hypothesis, I am going to use a different article using the same calculator process used for my first hypothesis. When I have located the article, I will choose 20 sentences for the same reason as the 100 words. I am also going to exclude numbers, people's names and quotes. However, I am going to include words like can't and hyphenated words, again for all the reasons mentioned previously.
To fulfil the terms of my third and final hypothesis I am going to use the Gunning 'FOG' Readability Test, this is because it is the best to use for secondary and older primary age groups, which the readers of the four newspapers I am investigating are more likely to be. The Gunning 'FOG' Test can be done with a simple formula, which is:
[(L+N) x 0.4] + 5 years
L being the average sentence length and N being the number of words with three or more syllables from a 100-word sample. The average sentence length will be worked out from the sample taken to find out the word length. Then I will count the number of words with three or more syllables thus completing the formula.
The maths - the most important bit
Lets say I've got all the data needed, the word length, the words per sentence, everything, now all I need to do now is analyse the data and compare them. Using maths.
I will say what maths I'm going to do for the word length firstly, then for the words per sentence. For the word length investigation I will find out the mean average, the mode and I will also use standard deviation. The first thing I'm going to do is convert the tally (in the tally chart) to a frequency and then an FX column, then I can calculate the mean with the formula: ?fx / ?f, where f is the frequency and x is the word length (? means 'the sum of'). The mean is the most common form of finding an average and probably the most accurate, by using this technique I can find a good and reliable average. The mode may not reflect the rest of the table but it is a good estimate and could help me in my investigation. The standard deviation process measures the spread of the data about the mean value. I am using this because it is useful in comparing sets of data, which may have the same mean but a different range. After I have done all the maths for this part of my coursework I will compare the averages to see whether or not my predictions were correct and what I could also do is once I have found out all the averages for all the four newspapers. I could find the mean for the tabloids and the broadsheets - add up the mean for 'The Daily Mirror' and 'The Sun', and add up the mean for 'The Times' and 'The Daily Telegraph'. This will help me get an even more accurate result. I will then see which is the higher, the broadsheet or the tabloid, this will help me answer my hypothesis. I am not going to compare my mode as it doesn't reflect all my results. I am, however, going to compare the standard Deviation result as it is may be my second most accurate finding.
For my words per sentence investigation I am going to use a number of mathematical techniques including a mean average, a cumulative frequency diagram and a box plot. There is a problem however; grouped data is quite difficult to find a mean for. When you are given data, which has been grouped, you cannot work out the mean exactly because you do not know what the values are exactly (you just know that they are between certain values). However, we calculate an estimate of the mean with the formula: ?fx / ?f , where f is the frequency and x is the midpoint of the group (? means 'the sum of'). It must be understood that this is only an estimate of the mean and is not that accurate but one of the closest I will get. After this, I will use the same process as I did before I will find a total mean average for both the tabloids and the broadsheets. Then I will draw a cumulative frequency diagram and then a box plot, but firstly, I must find the cumulative frequency. This is the running total of the frequencies. On a graph, it can be represented by a cumulative frequency polygon, where straight lines join up the points, or a cumulative frequency curve. I will then proceed to find out the Median and the interquartile Range. If we divide a cumulative frequency curve into quarters, the value at the lower quarter is referred to as the lower quartile, the value at the middle gives the median and the value at the upper quarter is the upper quartile. The interquartile range is a method of measuring the spread of the middle 50% of the values and is useful since it ignore the extreme values. Finally, I am going to draw box plots, I am going to compare 'The Daily Telegraph' with 'The Sun' and 'The Times' with 'The Daily Mirror' this is used from the cumulative frequency diagram and I'm using it so I can make it easier for myself to compare between the four newspapers afterwards.
Now that I have completed my results, I must analyse, compare and check whether I am right. The first thing I said I would compare was the averages, I have found out both the Total Broadsheet Average Mean and the Total Tabloid Average Mean. For the broadsheets, it turned out to be 4.68 letters in each word and for the tabloids 4.92 letters in each word. This is not really a massive difference although I am quite surprised that the tabloids got an overall bigger result, I was expecting the broadsheets to be much higher than the tabloids. These results are probably the closest I will get to answering the editor's concerns. So far, then, my hypothesis was incorrect. The standard deviation result was, again, in favour to the tabloids, 'The Daily Mirror's result was 2.56 and 'The Sun's result was 2.67. 'The Daily Telegraph's result was 2.38 and 'The Time's result was 2.49, this is again an unexpected result as I expected the broadsheets to outstrip the tabloids by a considerable amount, this has proved me wrong. There is, however, one anomaly, which may have contributed to these unpredicted results. In 'The Sun', the number of words with 13 letters was quite remarkable, it was five words, and I may have collected the data wrong or something likewise. There was also one thing that may have affected my results, as I collected the data, I had a tendency to not concentrate fully on what I was collecting so I may have ticked of a wrong column instead so this may have accidentally biased my investigation. Overall, my hypothesis was very insignificant as I got it completely wrong.
I could not, for the words per sentence investigation, get a fully accurate mean average as I had grouped data, the technique I used only allowed me an estimate of the mean, nevertheless, it is the most accurate I have. The total tabloid mean average is 15.83 letters in each word and the total broadsheet mean average is 19.63 letters in each word. The broadsheet average of 19.63 letters is quite a lot more than the tabloid average of 15.83, there were no anomalies and I have conducted this investigation thoroughly and without mistakes so it can be safely said that these results are accurate. My second hypothesis was totally correct (so far), although I did expect the tabloid words per sentence to be much lower than 15.83 but nevertheless I was right in that the number of words per sentence in a broadsheet is higher than that of a tabloid. The cumulative frequency curve for 'The Times' is quite straight and consistent (except for the last bit), whereas, 'The Daily Mirror' is very uneven. 'The Sun' goes all the way up and then loses its steepness at the end but 'The Daily Telegraph' is the opposite - it goes less steep at the beginning and then it begins to get steeper. The median value for all the newspapers ranges from 11 to 20, 'The Sun' has a median value of 11.5 while 'The Daily Mirror' has a median of 17.5, and the gap between these two values is quite big, which is unexpected as I thought these two values would be quite similar. 'The Times' got 16 and 'The Daily Telegraph' got 20, overall the broadsheets got a higher median value than the tabloids but 'The Daily Mirror' got more than 'The Times', this is not significant as it is only by a small amount. The interquartile range is a better estimate than the mean. The IQR for 'The Daily Mirror is much more than that of 'The Times' and 'The Daily Telegraph' is also much more than 'The Sun'. Overall, the tabloids have the bigger interquartile range, this is unexpected and may weaken my hypothesis.
'The Daily Telegraph' is more to the right than 'The Sun' and both of their lower quartiles nearly meet. The medians are a long way apart from each other and it is evident from the box plot that 'The Daily Telegraph' had much more WPS. In addition, the highest WPS is in 'The Daily Telegraph' although this is not necessarily an accurate finding. 'The Daily Mirror' and the 'The Times' are very similar to each other, they both have the exact lower quartile and their medians are very close together. The right hand box of 'The Daily Mirror' is considerably bigger than 'The Times'. The highest value belongs to 'The Times'. 'The Times' did better because of the size of the right hand box and because of the highest value. In conclusion, the broadsheet's box plots did much better than the tabloids box plots.
The reading age for 'The Times' was 15.2 years and 'The Daily Telegraph' was 19.3 years. 'The Sun' is 12.67 and 'The Daily Mirror' is 14.79. The reading ages for readers of broadsheet newspapers are relatively high especially 'The Daily Telegraph' and my predictions were correct.
Conclusion
According to my results, my first hypothesis is incorrect, my second hypothesis was correct and so was my last hypothesis.
Evaluation
I could have improved my investigation in a number of ways, I could have used more samples and picked more random samples, this would have made my results as accurate as possible, the more you use - the more accurate you are. I could also have selected more newspapers. I also could have used more 'FOG' and 'SMOG' tests as this may have helped me with my investigation. I could also have compared further results and conducted further mathematics if I had been given time.