Mayfield High Statistics Coursework
Mayfield High Statistics Coursework Introduction I am going to complete a statistical investigation around the fictitious data of Mayfield high school, which has data that would represent a real school. I will be using various techniques that I have recently learnt, studied and captured to produce a successful & efficient piece of coursework. Mayfield high is a fictitious school that consists of 1183 male and female students in years 7 to 11. The data given to me on these students comprises of height, weight, eye colour, favourite TV program, hair colour, eye colour, gender and favourite type of music etc. Data Data is made up of a collection of variables. Each variable can be described, numbered and measured. * Data that can only be described in words is qualitative. Such data is organised into categories, such as make of car, colour of hair, etc . * Data which is given numerical values, such as shoe size or height, is quantitative. This type of data can be sorted into two categories: - Discrete data can only take certain values, usually whole number, but may include fractions (e.g. shoe sizes). - Continuous data can take any value within a range and is measurable (e.g. height,

Statistics "Mayfield high school" - the taller the person the more they weigh.
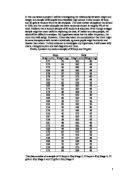
MATHS COURSEWORK STATISTICS "MAYFIELD HIGH SCHOOL" STUDENT: RAHEEM MIRZA TEACHER: MS LEWIS Part 1: Introduction/Aim I imagine that the taller the person is the more they weigh, due to body mass. I also assume that the gender doesn't have an effect on their height and weight. I will try and prove or disprove this in my investigation. I will take people from Key Stage 3. Part 2: Method: Using Microsoft Excel, i selected 40 random people from the Mayfield High School database. I chose to use the formula =SUM ()*40. This automatically gave me 40 students which are below. Part 3: My 40 Random Result Random Result Number Year Group Gender Height (cm) Weight (kg) 671 9 Female 59 50 687 2 9 Female 56 50 261 3 7 Male 56 39 342 4 8 Female 75 64 584 5 9 Female 80 82 445 6 8 Male 67 51 388 7 8 Female 80 58 428 8 8 Male 54 37 646 9 9 Female 65 52 291 0 8 Female 68 59 224 1 7 Male 48 26 309 2 8 Female 63 42 654 3 9 Female 65 49 469 4 8 Male 65 40 262 5 7 Male 49 35 353 6 8 Female 60 46 635 7 9 Female 60 40 804 8 9 Male 80 42 685 9 9 Female 52 50 388 20 8 Female 80 58 479 21 8 Male 68 51 75 22 7 Female 66 45 94 23 7 Female 73 51 552 24 9 Female 60 60 548 25 8 Male 52 45 468 26 8 Male 82 54 238 27 7 Male 60 40

maths coursework t-shapes
Introduction: In this investigation I will establish the link between the T-Total and the T-Number. The aim of my coursework is to find any pattern or link between T-Total and T-Number. By obtaining a formula, I will be able to find the T-Total if I am giving the T-Number and vice versa; without having to draw number grids. Furthermore, by obtaining various formulae, I will then be able to deduce a general formula for all grid tables. After investigating the relationship between the two, I will then use grids of different sizes and translate the T-Shape to different positions; to see whether the pattern changes or stays the same. In this coursework I will be using the terms T-Total and T-Number frequently, so we need to know what they mean. 2 3 4 5 6 7 8 9 0 1 2 3 4 5 6 7 8 9 20 21 22 23 24 25 26 27 28 29 30 31 32 33 34 35 36 We have a grid nine by four with the numbers starting from 1 to 36. There is a shape in the grid called T-Shape. This is highlighted in the colour yellow. This is a T-Shape drawn on a nine by four number grid. The total of the numbers inside the T-Shape is 1+2+2+11+20=37. This is called the T-Total. The number at the bottom of the T-Shape is called the T-Number. The T-Number for this T-shape is 20. Method: I will carry my investigation out in the following steps: . Firstly, I will draw number grids of

In this coursework I want to find out what the average height, weight, and arm span of a Year 11 pupil is
Philip Davies 11B 8th February 2005 The Average Year 11 Pupil Hypothesis In this coursework I want to find out what the average height, weight, and arm span of a Year 11 pupil is. I think that my height, and arm span will be 10% more than the average Year 11 pupil, and my weight will be 5% more than the average year 11 Pupil, I want to find out if this is correct. I will also compare the height, weight, and arm span of an average Year 11 male to an average Year 11 female, because I think that an average Year 11 male will be 10% taller, heavier, and have a 10% longer arm span than an average Year 11 female. Finally, I want to find out if an average Year 11 pupil is square, and if an average Year 11 male is squarer than an average Year 11 female. The calculations and graphs that I am going to make are; * Histogram * Interquartile Range * Mean * Box & Whisker * Mode (Modal Group) * Standard Deviation * Cumulative Frequency Graph * Scatter Diagram * Median Each pupil in Year 11 measured their own height, weight, and arm span, and all the data was collected and put in a table. So the data we are using is Primary Data because we have collected it. The sampling which I used to get my data was systematic sampling. To get better results I left out any sets of data with missing measurements. I chose every 4th set of data and recorded

What affects a persons ability to estimate?
GCSE STATISTICS: COURSEWORK 'WHAT AFFECTS A PERSON'S ABILITY TO ESTIMATE?' Presentation of data, Calculations and Interpretation and Conclusions: Now that I have collected all the data, I can now begin to analyse the results and find out whether either: age, intelligence or gender affect a person's ability to estimate. To begin with I will investigate Age. By beginning with Age I can expand the investigation further by changing the variables one at a time. I will start simply by looking at the year groups and age groups. This will enable me to see whether theirs a difference. I will later go into more depth by comparing years. I will have clear views of the results by using a variety of graphs and charts regularly. I have used the Average and Standard Deviation functions on Microsoft Excel to calculate these results. The answers have been rounded to the nearest 2 decimal places to make it clearer for readers to understand. A bar graph is below to see the results more clearly and visually: To get an even better view of the spread of results I've now put them in a box and whisker diagram, shown below. The calculations for the quartiles I found by using the function 'Quartile' on Microsoft Excel. By doing this I'll have a better idea of the dispersion of data these Year groups have. Observations and conclusions: - By studying the box and whisker diagrams I can see that
Investigating the relationship between height and weight in a sample of 60 pupils.
In this coursework project I will be investigating the relationship between height and weight in a sample of 60 pupils from Mayfield high school. I have chosen 30 boys and 30 girls at random from the list of pupils. The total number of pupils at the school is 1183, and the number of pupils that were randomly chosen is roughly 5% of the total. I believe that a random sample of 60 students is adequate. Even though a bigger sample might be more useful in exploring the data, if I select too many people, the data will be difficult to analyse. My hypothesis states that the taller the person, the more they will weigh. However, I have also taken into consideration that there might be some exceptions with certain individuals, eg some pupils might be shorter and heavier than others. To find evidence to investigate my hypothesis, I will create tally charts, histograms,stem and leaf diagrams and more. Firstly, I present my random sample of 30 boys and 30 girls: Boys Girls Height (cm) Weight (kg) Height (cm) Weight (kg) 77 72 83 60 72 64 65 42 75 45 03 45 64 60 63 48 78 37 70 54 70 57 75 60 85 73 67 48 66 63 50 45 62 56 63 44 75 65 65 48 73 48 80 74 83 75 55 50 80 68 65 54 80 59 51 36 62 92 62 56 54 42 49 40 70 55 60 42 53 45 75 47 61 48 65 52 50 50 62 45 61 46 62 46 73 66 62 49 60 44 60 57
Introduction to arodynamics - Investigation into the design features of aircraft.
GRADE ASSIGNMENT COVER SHEET STUDENT NAME D R HARLOW RANK Fg Off No 8401440B COURSE No/ENTRY 247/1 ASSIGNMENT TITLE INTRODUCTION TO AERODYNAMICS - INVESTIGATION INTO THE DESIGN FEATURES OF AIRCRAFT ASSIGNMENT No AB 912 VERSION A BTEC UNIT 21783P COMPLETION DATE 3 OCT 2003 TUTOR'S NAME MR RENE WILKINSON CERTIFICATE OF ORIGINALITY This assignment report is entirely the original work of the author except for the sources and extracts listed in the bibliography at the back of this document. All direct quotes are enclosed within quotation marks and attributed to the source material, including the page number, directly afterwards. Signature Date ADVANCED ENGINEERING GROUP Royal Air Force Cosford Albrighton WOLVERHAMPTON West Midlands WV7 3EX Tel: (01902) 372393 DFTS: 95561 Ext 7743 BTEC HIGHER NATIONAL CERTIFICATE IN ENGINEERING Course No 1247/1 Fg Off D R Harlow EngTech MIIE RAF INTRODUCTION TO AERODYNAMICS - INVESTIGATION INTO THE DESIGN FEATURES OF AIRCRAFT CONTENTS AIMS . The aim of this assignment is to study the design features of various aircraft including: a. Describing and explaining the design features of a fast jet aircraft with reference to transonic and supersonic speeds. b. Describing and explaining the design features of a transport aircraft with references to its longitudinal and lateral stability. INTRODUCTION 2. In
MAYFIELD HIGH SCHOOL.
G.C.S.E MATHEMAMATICS PROJECT. MAYFIELD HIGH SCHOOL. Andrew LARBI Introduction: Mayfield High School is a school that has been made up in order for us the students to finish this project. Although the school is fictitious the data presented is based on a real school. I think the name of the school was made up in other to prevent any embarrassment. In Mayfield High School, there are 300 students in year seven of which150 are boys and 150 are girls, in year eight; there are 145 boys and 125 girls all adding up to 270, there are 260 in year nine, 120 boys and 140 girls. Year ten have 100 boys and 100 girls making 200 students. Year eleven have the smallest number of students, that is 84 boys and 86 girls all adding up to 170 students. I have shown all this clearly in the table below: YEAR GROUP NUMBER OF BOYS NUMBER OF GIRLS TOTAL 7 50 50 300 8 45 25 270 9 20 40 260 0 00 00 200 1 84 86 70 The total number of students in Mayfield high school is 1200. Data has been provided on each student as: Name, Age, year group, IQ, weight, height, hair colour, eye colour, shoe size, distance from home to school, usual method of travel to school, number of brothers or sisters, key stage 2 results in English, mathematics and science, key stage 3 results in English, mathematics and science. This means I have a total of 1200*18=21600 datum points From which I can
Height and weight
You are in: Coursework and Essays > GCSE > Maths > Height and Weight of Pupils Statistics investigation - The relationship between height and weight of males and females of year 7 - The relationship between two sets of Key Stage 2 results, (Maths and Science) - The relationship between IQ and Key Stage 2 (English) results in year 7 * Download the original word document * Save this to your mycoursework page * View the word count and other details * Learn about Plagiarism Mayfield High School Statistics Investigationcofb fbr sefbfbw orfb fbk infb fofb fb. Aim avi Visit coursework bd in bd fo bd for bd more dissertation bd Do bd not bd redistribute avi · The relationship between height and weight of males and females of year 7.coee eer seeeeew oree eek inee foee ee. · The relationship between two sets of Key Stage 2 results, (Maths and Science).cobc bcr sebcbcw orbc bck inbc fobc bc: · The relationship between IQ and Key Stage 2 (English) results in year 7.cofc fcr sefcfcw orfc fck infc fofc fc: Plancoca car secacaw orca cak inca foca ca. I will collect the information that is provided be Mayfield High School for this investigation.cofg fgr sefgfgw orfg fgk infg fofg fg. . The relationship between height and weight of males and females of year 7. I expect males to be heavier and taller than females in year 7.cofg fgr sefgfgw orfg fgk infg fofg fg. 2. The
Mayfield Maths Coursework
Maths Coursework My Hypothesis The hypotheses that I will investigate are: : The higher the IQ results the higher the Key Stage 2 results. I think that this is true because both the IQ and the key stage 2 levels are meant to be indicators of intelligence. If this is true then the two should have a fairly large degree of correlation 2: Girls are more intelligent than boys. I want to test this as many reports over the last few years have said that girls are much more intelligent than boys, I want to see if this is true with the sample that I have chosen. Introduction I am going to investigate the relationship between the IQ and the Key Stage 2 results for English, Maths and Science. I will compare the IQ results with the Key Stage results to find out if there is a correlation. I will then use a sample to test the hypothesis that girls are cleverer than boys. I will find this using information about a school called Mayfield Data High School, which was provided by the exam board. The spreadsheet provided by the exam board contains 1183 sets of data. This would be too many to investigate and so, for my research so I will use 10% of the data (approximately 120), which should be large enough to give me accurate results. For my investigation I will only need to use the following information to help me with my task: o The IQ o KS2 results for English, Maths and Science