
How is chalk formed?
Geography homework Ronak Kansagra Mr.Judd How is chalk formed? How have the chalk landscapes been formed? The Chalk has long been considered to be a period of relatively quiescence in terms of mountain building and therefore little attention was paid to tectonic phases within the Chalk. These are now known to have occurred, plus much of the sedimentation is now thought to have been controlled by local and individual structural blocks. Faults in the UK are generally of a displacement of less than 10m, commonly in the range 1-5m. There are typically 3 sets of major joints, one sub horizontal and sub parallel to the bedding, one conjugate set of high angle and one conjugate set of sub vertical joints. Jointing is partly controlled by litho logy, joints often terminating at bedding planes, with high angle fractures being more typical in marly chalks. In Yorkshire the chalk of the Yorkshire wolds and the cliffs at Scarborough are much harder than the chalks of Southern England and exhibit stylolites. Chalk is perhaps most associated with a gently rolling landscape such as the North and South Downs in England. As it can be dissolved by rainwater it is Karstic with such features as caves, sink holes and karstic cavities occurring along faults, flints and marls. The scarp slopes of the Downs were oversteepened during the Ice Ages. Chalk cliffs (of Southern England and NW
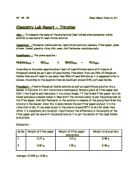
To measure the mass of the precipitate (lead iodide) when potassium iodide solution is reacted with lead nitrate solution.
20 - 09 - 05 Jheal Shah ( Chem HL B1) Chemistry Lab Report - Titration Aim: - To measure the mass of the precipitate (lead iodide) when potassium iodide solution is reacted with lead nitrate solution. Apparatus: - Potassium iodide solution, lead nitrate solution, beakers, filter paper, glass stirrer, funnel, pipette, china dish, oven, distilled water, weighing scale. Hypothesis: - The given equation - Pb(NO3)2(aq) + 2KI(aq) --> 2KNO3(aq) + PbI2(ppt) According to the given equation when 1 part of Lead Nitrate reacts with 2 parts of Potassium Iodide we get 1 part of Lead Iodide. Therefore if we use 20ml of Potassium Iodide then we will need to use more than 10ml of Lead Nitrate as it is supposed to be in excess. According to the equation then we would get around 0.46 g of Lead Iodide. Procedure: - Pipette Potassium Iodide solution as well as Lead Nitrate solution into a beaker in the ratio 2:1. Stir the mixture continuously. Weigh a piece of filter paper and fold it into 4 parts and then make it in a conical shape. Fit the folded filter paper into the funnel and place a beaker below it. Now distill the mixture slowly to get the precipitate on the filter paper. Add distilled water to the solution to remove all the precipitate from the mixture in the beaker. Once this is done remove the wet filter paper and put it in the china dish to dry. It can even be put in the
Eating Disorders.
Eating Disorders. Anorexia nervosa. Anorexia nervosa literally means, 'loss of appetite for emotional reasons'. People with Anorexia neither lose their appetite nor their interest in food- they usually have strong feelings of hunger and are preoccupied with food. Their primary concern, often described as an obsession, is to lose weight. This drive for thinness is accompanied by an intense fear of being overweight. Failure to lose weight - or worse putting on weight - often leads to depression, anxiety and panic. Anorexics usually take great pride in their ability to lose weight and to control their desire to eat. Many are not satisfied with their weight loss, and this drives them deeper into the disorder. Anorexics tend to have a distorted view of their body. They over estimate their body size and proportions. Where others see them as thin or even emaciated, they often see themselves as grossly overweight. Some accept that they are thin, but see certain parts of their body, e.g. stomach, thighs or bum, as 'too fat'. This distorted image is maintained despite frequent measurements of body parts, weighing themselves and checking their body in a mirror. Anorexia typically starts with a diet when a person is slightly overweight. It develops into a disorder when the pursuit for thinness is relentless, when food intake is severely restricted, when weight loss is rapid
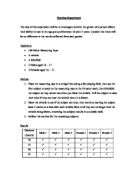
gender of a person affects their ability to hear
Hearing Experiment The aim of this experiment will be to investigate whether the gender of a person affects their ability to hear in the age group of between 16 and 17 years. I predict that there will be no difference in the results collected from each gender. Apparatus * 100 Meter Measuring Tape * A whistle * A blindfold * 3 Males aged 16 - 17 * 3 Females aged 16 - 17 Method . Place the measuring tape in a straight line along a flat playing field, then ask the first subject to stand on the measuring tape at the 10 meter mark, then blindfold the subject so they cannot see when you blow the whistle. Tell the subject to raise their hand if they can hear the whistle when it is blown. 2. Blow the whistle to see if the subject can hear, then continue moving the subject back 5 meters at a time after each whistle blow until they can no longer hear the whistle being blown, recording the subjects results in a suitable table 3. Follow this method for the remaining subjects Results Distance (meters) Male 1 Male 2 Male 3 Female 1 Female 2 Female 3 0 * * * * * * 5 * * * * * * 20 * * * * * * 25 * * * * * * 30 * * * * * * 35 * * * * * * 40 * * * * * * 45 * * * * * * 50 * * * * * * 55 * * * * * * 60 * * * * 65 * * * 70 75 * =
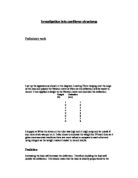
Investigation into cantilever structures
Investigation into cantilever structures Preliminary work I set up the apparatus as shown in the diagram. Leaving 75cm hanging over the edge of the desk and placed the Newton meter at 90cm as the deflection will be easier to record. I then applied a weight to the Newton meter and recorded the deflection. Weight (N) Deflection (cm) 2 2 3 3 4 4 5 5 6 6 7 7 8 8 I stopped at 8N as the stress on the ruler was high and it might snap and be unsafe if any more strain was put on it. I also chose to increase the weight by 1N each time as it gives more accurate results as there are more values to compare to each other and using integers as the weight makes it easier to record results. Prediction Increasing the load will increase the deflection. Therefore doubling the load will double the deflection. This would mean that the load is directly proportional to the deflection. Assuming the ruler is elastic and that the pivot doesn't change. This is because Moment = perpendicular distance*force As the perpendicular distance is a constant thorough the experiment the doubling of the load will double the moment which will cause the cantilever to deflect downwards. Apparatus Method The apparatus was set up as shown in the diagram. Add the weight hanger at the 90cm mark on the ruler measure how far the pointer has moved downwards and record the deflection. Remove the
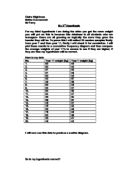
For my third hypothesis I am doing the older you get the more weight you will put on this is because this database is all students who are teenagers- these are all growing so logically the more they grow the heavier they will be.
Claire Wightman Maths Coursework Mr Parry My 3rd Hypothesis For my third hypothesis I am doing the older you get the more weight you will put on this is because this database is all students who are teenagers- these are all growing so logically the more they grow the heavier they will be. To prove this I will collect 20 random samples firstly from year 7 and then year 11, firstly I will check it for correlation. I will plot these results in a cumulative frequency diagram and then compare the average weights of year 11's to sevens to see if they are higher; if they are then my hypothesis will be correct. Here is my data No. Year 11 weight (kg) Year 7 weight (kg) . 60 45 2. 63 40 3. 51 40 4. 51 45 5. 63 45 6. 52 57 7. 39 38 8. 63 45 9. 54 47 0. 60 50 1. 84 47 2. 55 54 3. 86 57 4. 48 31 5. 48 40 6. 50 49 7. 76 45 8. 62 39 9. 55 47 20. 48 42 I will now use this data to produce a scatter diagram. So is my hypothesis correct? * There was a positive correlation in my scatter diagram, which would indicate this is the case because the line of best fit is slanted slightly lower and across which means the year seven spread is generally a lower amount. * I will now plot a cumulative frequency diagram for each year. Year 11 Class int. (x) 25<X<35 35<X<45 45<X<55 55<X<65 65<X<75 75<X<85 85<X<95 Frequency
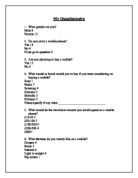
Business Report part 5 (questionaire)
My Questionnaire . What gender are you? Male 8 Female 12 2. Do you carry a mobile phone? Yes 14 No 6 If yes go to question 4 3. Are you planning to buy a mobile? Yes 12 No 8 4. What model or brand would you to buy if you were considering on buying a mobile? Sony 1 Nokia 7 Samsung 4 Siemens 2 Motrolla 3 Errikson 3 Please specify if any other ______________________________ 5. What would be the maximum amount you would spend on a mobile phone? £10-50 2 £50-100 5 £100-200 9 £200-500 4 £600+ 6. What features do you mostly like on a mobile? Camera 4 Radio 3 Internet 6 Light in weight 4 Big screen 1 Voice activated 2 Please specify if any other_________________________________ 7. What is your occupation? Professional 4 Self employed 3 Office retail 2 Banking 2 Student 6 Skilled/manual 3 Other e.g. house person__________________________________ 8. What tariff would you connect to? T-mobile 8 Vodaphone 2 Cellnet 1 Virgin 2 Orange 1 Phone cards 6 Other please specify 9. How old are you? U15 5-20 10 20-30 6 30-50 4 50 and over 0. Where would you normally purchase your mobile phone? Woolworth's Carphone warehouse 9 Vodaphone shops 4 The links 3 One 2 one shops 3 Argos 1 Other e.g. phones 4 u___________________________________ 1. What accessories would you mostly prefer to be included with a mobile? Leather cases 1
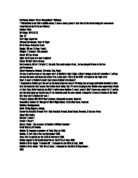
Robbie Williams Biography
Full Name: Robert Peter Maximiliam* Williams * Maximilian is not Rob's middle name, it was a name given at the time of his christening but was never recorded on his birth certificate. Gender: Male Birthday: 1974.02.13 Age: 27 Star Sign: Aquarius Chinese horoscope: Year of Tiger Birth Place: Stoke-On-Trent Height: 185 cm ( 6 feet 1 inch ) Weight: 11 stones ( 154 pounds ) Colour Of Eye: Green Sight: Both eyes are short-sighted Colour Of Hair: Dark Brown Instruments: Guitar ( Grade 3 ), his pink flute and maybe drum... he has played drums in his live performances Advertisements: Reebok, Versace, 7up, Pepsi. Tattoo: A celtic-cross at the upper part of Robbie's right thigh, a Maori design on his left shoulder, it will go across his back and down his other arm. A lion and a 'Born To Be Wild' tattooed on his right arm. Scar: A scar at Robbie's head ( just above Robbie's forehead ) ( Explanation: Robbie got the cut on his head when he was in TT! Being the strange lad Robbie decided to dive into the fountain that was in the Italian hotel lobby that TT were staying in but Robbie was apparently drunk at that time. Unfortunately he didn't realise how shallow it was ( even it didn't have any water in it ) and he cut his head open on the bottom of the fountain pool! He was rushed to hospital to have stitches in his head! But then that's Robbie for you. ) Primary School:
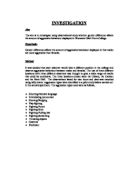
Investigate using observational study whether gender difference affects the amount of aggressive behaviour displayed in Worcester Sixth Form College.
INVESTIGATION Aim The aim is to investigate using observational study whether gender difference affects the amount of aggressive behaviour displayed in Worcester Sixth Form College. Hypothesis Gender difference affects the amount of aggressive behaviour displayed in that males are more aggressive than females. Method It was decided that each observer would take a different position in the college and observe aggressive behaviour between males and females. The use of three different locations with three different observers was thought to give a wide range of results that could be conclusive. The three locations chosen were the Library, the Canteen and the Main Hall. The observations lasted for two hours and data was recorded using tally charts. Aggression types were identified in a pilot study before carried out in the actual experiment. The aggression types used were as follows, * Shouting/Abusive language * Intimidating eye contact * Shoving/Nudging * Play fighting * Fighting-Punch * Fighting-Kick * Fighting-Pulling hair * Fighting-Scratching * Throwing objects * Gestures * Exclusion Results Observer 1 Tally Chart (Canteen) Aggresion types MALE FEMALE Shouting/ abusive language //// Intimidating eye contact /// Shoving/nudging / Play Fighting ///// Fighting - punch Kick Pulling hair Scratching Throwing objects // / Gestures Exclusion
Hypothesis: As their age increases both girls and boys will grow in height and weight, but overall in each year the boys will always be taller.
Data Handling Project Introduction: I am going to be investigating the height, weight, gender and age/year group of pupils from Mayfield High School, the name of the school has been made up but the data is from a real school. I have randomly selected my data and I have put it in a spreadsheet, I have only looked at years 7, 9 and 11, this will give me a lot less data and should give me some varied results. I am investigating height and weight because the data is quantitive data therefore I can do averages and graphs. The data I am using is secondary data, this means that someone else has collected the data, the advantage of this is that it has saved me a lot of time but the disadvantage is that there could be some anomalies, if the data I select has an anomaly then I will just select the next piece of data, if I use the piece of data with the anomaly then it would affect all my results so I won't use it. Hypothesis: As their age increases both girls and boys will grow in height and weight, but overall in each year the boys will always be taller. Plan: . I will collect the data and take systematic samples. 2. I will draw frequency polygons to compare distributions 3. I will draw scatter diagrams so I can see if there is any correlation between height, weight, gender and age/year group, I will then be able to draw a line of best fit and compare them all 4. I will work