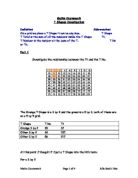
Diagram 7 – Table of Results For Diagrams 1-6
From this table I have discovered two consistent number patterns, I can see that for every square I move the T-shape to the right, the T-total increases by five from its previous T-total on its previous position on the grid. I can also see from Diagram 8 that the difference between ((T-total and the T-Shape) N) and ((T-total and the T-Shape) N +1) is 4 each time. N = position in the sequence.
These trends occur because when we move the T-Shape one square to the right, each square of the T-shape increases its value by 1. The T-shape is made up of 5 squares and so the T-total is increased by 5 each time it is moved to the right.
Diagram 8.
From my table of results (Diagram 7) I can predict that a T-Shape in the following location (Diagram 8) will have the following T-Total:
62 + 5 = 67.
However, I would like to investigate producing a consistent algebraic formula that could be used to find the T-Total anywhere on a 9x9 grid.
Diagram 9.
I will return to my predicted answer example, Diagram 8 and use the formula to work out its T-Total.
T-number of Diagram 8 = 26
For the purpose of developing algebraic formulae, the T-Number will be expressed as n.
T-total = (n) + (n – 9) + (n– 18) + (n – 19) + (n – 17)
We can simplify this to 5n – 63.
We get –63 because it is the total of the differences between the T-Number and the number in each of the other four squares. I can test the formula by using the numbers given in Diagram 8: (I subtracted each number in the T-shape from the T-Number except the actual T-Number square)
(26) + (26 – 9) + (26– 18) + (26 – 19) + (6 – 17)
This can be simplified as: 130 – 63 which equals a T-Total of 67.
To check the formula I can work out the T-Total by hand:
7 + 8 + 9 + +17 + 26 = 67.
There is also another place from which we can obtain 63 for our formula. 9x7 is also 63. (The nine would be attained from the grid being 9 squares across). I will investigate the x7 part of the formula in Part 2 when I investigate different grid sizes and their effects.
2 . Use grids of different sizes. Translate the shape into different positions. Investigate relationships between the T-Total, the T-Numbers and the grid size.
For part one I drew all my examples on 9x9 grids for consistency, however if I made my grid smaller or larger it would affect the position of the numbers within in and therefore affect the formula I investigated in part 1.
I will not draw any grids smaller than 3x3 as the T-shape requires a grid of at least 3x3 for it to be placed on. Also for the purpose of the trials I will use grids of square numbers, i.e. 4x4 and 7x7. Also for each trial into differing grid sizes, I will place the T-shape in the top left corner of each grid for consistency.
Diagram 10.
If I was to use my formula from the 9x9 grid to work out the T-total of Diagram 10 the total would be: 5n – 63 = (5x8) – 63 = -23
This is obviously wrong, as there are no minus numbers on the grid, it seems that we must investigate a new formula. However we can still use the framework (Diagram 9) we used to work out the 9x9 grid formula but we will have to edit it slightly.
Diagram 11.
r = new number which must be investigated.
From Diagram 10 I can do the following calculations relating them to the framework of Diagram 11:
(8 – 5 = 3) = N-r
(8 – 2 = 6 = 2 x 3) = N-2r
(8 – 6 + 1 = 3) = N-2r+1
(8 – 6 – 1 = 1) = N-2r-1
These calculations show that r=3.
So far the 3x3 formula looks like this:
(n) + (n-3) + (n-6) + (n-7) + (n-5) = T-Total Simplified as: 5n – 21.
Diagram 12.
My previous formulas, for the 3x3 grid and the 9x9 grid, do not work on this 4x4 grid, they give the following answers:
5n-21 = 29
5n-63 = -13
I know these formulas give me the wrong answer on this grid because I worked out the T-total by hand and it is: 22.
I will use Diagram 11 and its explanation to try and work out a formula for the 4x4 grid.
N = (10)
N-r = (10 – r = 6)
N-2r = (10 – 2r = 2)
N-2r-1 = (10 – 2r - 1= 1)
N-2r+1 = (10 – 2r + 1 = 3)
10 – 6 = 4 10 = 1 = 11
10 – 8 = 2
10 – 1 = 9
From looking at the equations above, the only number which would satisfy each one, is 4.


