Overall I think that the local newspaper and the local newspaper will both be similar, however I think that the quality newspaper will not be easier to read than the other two newspapers because the quality newspaper is aimed at intelligent people. Therefore the quality newspaper will not be quite easy as the other two newspapers.
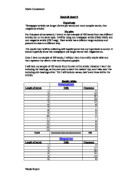
I will be doing this by picking out exactly the first 50 words out of each of the newspaper article and I will put them into a tally.
I will add the words to the row depending on how many letters there are in the word.
I will put them in to a talley and write how many letters are in each word. Once I have done that I will then compare the newspapers to each other.
I will also keep the test fair and eliminate by getting the three newspapers on the same day and choose similar articles to compare with each other. Another way that I will keeps this test fair and eliminate which will keep the test bias as well by not including the names of people that are in the articles and also not including place names.
I will be using cumulative frequency graphs to work out the median and quartiles. In this case I think that the tabloid newspaper will have the smallest median. I will also draw a box plot which will show the spread of the data in the three articles and which will also help me to come to a conclusion and will show me which article was the most easiest to read depending on the word length.
In my coursework I compared three newspaper articles that were about the same story in three different newspapers which were ‘The Sun’ (tabloid newspaper), ‘Sheffield Star’ (local newspaper) and ‘Telegraph’ (quality newspaper).
I was testing the readability and in my hypothesis I thought that the tabloid newspaper would be easier to read.
For each article, I did a tally chart for the word length. After I had done this and gathered the data I also worked out the frequency and cumulative frequency. I did this so that I would be able to draw a cumulative frequency graph which would show all the data on the graph for each of the newspapers article.
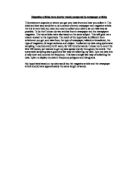
I also did a box plot from the cumulative frequency graph which showed me the word length of each newspaper article.
The box plots that I have drawn show that the tabloid is the hardest newspaper to read. This is because the spread starts at 2.3 and ends at 5.6 and the median is 3.6. The quality newspaper box plot spread starts at 1.7 and ends at 5 and the median is 2.9. The local newspaper starts at 2 and ends at 5.4 and the median is 3.
This shows that the tabloid is the hardest to read because the box plots show that the tabloid newspaper includes the most difficult words than the other two newspapers.
Furthermore, I also wrote in my hypothesis that the local newspaper will be easier to read than the tabloid. This has been proven correct because the spread for the local newspapers starts and ends at lower figures compared to the tabloid.
However the lowest spread from all three of the newspaper articles was the quality newspaper. This is because it starts and ends with the lowest figures form the other two newspapers however it does have the same mean as the local newspaper which shows that it is suite similar to the local newspaper.
This shows that my prediction is my hypothesis about the tabloid newspaper being the easiest newspaper to read and also the local newspaper being easier than the tabloid newspaper to read. This shows that my prediction was wrong because the easiest newspaper to read was the quality newspaper because that was the newspaper that has the lowest spread.