Investigate the difference of the product of the diagonally opposite corners of a certain shape, drawn on a 10x10 grid with the individual squares numbered off 1 to 100.
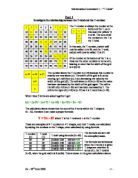
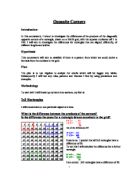
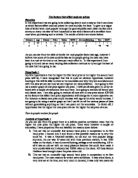
Maths Coursework Aim: I task is to investigate the difference of the product of the diagonally opposite corners of a certain shape, drawn on a 10x10 grid with the individual squares numbered off 1 to 100 I will start off by working this out on a 2x2 square and from there I will begin to investigate varying the length and width of rectangles and other squares. I will aim to investigate the differences for different sized rectangles and squares that are aligned differently on the grid. I will record findings and ideas as I proceed. Method: To make things easier for me I will break up each investigation in to sections, I will start with: 2x2 square I will concentrate on one particular aspect at a time. * What is the difference between the products of the corners? * Is the difference the same for a square or rectangle the same shape anywhere on the grid? 2 3 4 5 6 7 8 9 0 1 2 3 4 5 6 7 8 9 20 21 22 23 24 25 26 27 28 29 30 31 32 33 34 35 36 37 38 39 40 41 42 43 44 45 46 47 48 49 50 51 52 53 54 55 56 57 58 59 60 61 62 63 64 65 66 67 68 69 70 71 72 73 74 75 76 77 78 79 80 81 82 83 84 85 86 87 88 89 90 91 92 93 94 95 96 97 98 99 00 2 x 11 = 22 x 12 = 12 Diff = 10 Are all the differences 10? 46 x 55 = 2,530 45 x 56 = 2,520 Diff = 10 It seems so. I now predict
The factors that affect used car prices.
The factors that affect used car prices Planning In this experiment we are going to be collecting data in such a way so that it can show us which factors affect used car prices the most and also the least. To give us a vague idea of which were most popular amongst the general public each class member did a survey on every member of their household to see which factors of a car affect them most when purchasing such a vehicle. The results of which are shown below. Owners Age Colour Price Make MPG Air conditioning Tax MOT 5 29 3 3 22 9 1 6 7 3 2 5 4 =8 =8 As you can see from the table of results the most popular factor was age, however I believe that some of the data could be bias as the people giving the data may have been in a rush at the time or not have put much effort in. In this experiment I am going to try and use as many varying data collection methods to try and get the best of the data that I am going to use. Hypothesis 1 My first hypothesis is that the higher the first hand price is the higher the second hand price will be, I have recognised that this is quite an obvious hypothesis, however looking at this will be able to show us the anomalies and why they are anomalous and with this data we can see how we can improve our data collection. I am going to first use a scatter graph of new price against old price. I will use all data given to
T Shapes Investigation
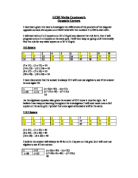
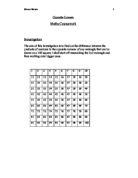
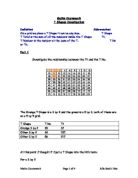
Maths Coursework T Shapes Investigation Definition Abbreviation: On a grid we place a T Shape it can be any size. T Shape T Total is the sum of all the numbers inside the T Shape Tt. T Number is the number at the base of the T. T No or Tn. Part 1 Investigate the relationship between the Tt and the T No. 2 3 4 5 6 7 8 9 0 1 2 3 4 5 6 7 8 9 20 21 22 23 24 25 26 27 28 29 30 31 32 33 34 35 36 37 38 39 40 41 42 43 44 45 46 47 48 49 50 51 52 53 54 55 56 57 58 59 60 61 62 63 64 65 66 67 68 69 70 71 72 73 74 75 76 77 78 79 80 81 The Orange T Shape is a 3 by 2 and the green is a 5 by 3, both of these are on a 9 by 9 grid. T Shape T No Tt Orange 3 by 2 20 37 Other 3 by 2 34 107 Other 3 by 2 56 217 At this point I thought if I put a T Shape into the Nth term: For a 3 by 2 2 3 1 20 Goes to n-19 n-18 n-17 n-9 n = 5n-63 Therefore to make it a formula it becomes Tt=5n-63 Now I began to explore how to find certain numbers such as the 5 and the minus 63. The only numbers I can work with are the 3 and the 2 from the t shape, the 9 from the grid. So the obvious way to get the 5 is from the t shape. So the 3 we call the T width or W. And the 2 is the t height or H Now we have Tt = (H+W)n-63 Next I tested this out with a 3 by 2 t shape, with a T No of 20 Tt =

My aim is to investigate if the distance of an object from a light source affects the length of the objects shadow.
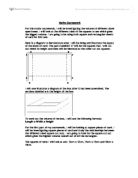
Sc1 Coursework - Shadows PLAN (P) Aim My aim is to investigate if the distance of an object from a light source affects the length of the objects shadow. Background Scientific Information A shadow is what is formed when some rays of light continue to travel in straight lines while other rays are stopped by an opaque object. Shadow due to a small source of light Shadow due to a large source of light There are other and practical uses of shadows as well though, a sundial can be created by shadows using the height and position of the sun to created by shadows using the height and position of the sun to create a shadow which tells someone what the time is. These were used before clocks were invented. The height and position of the light source affect the size of a shadow. E.g. how close it is to the object. Prediction I think that an ecliptical shadow will be formed during this experiment because we are using a solid and opaque object to test with which is a glue stick. I think that when the position of the light source is further away from the object, the shadow will get longer this is because more rays are directly hitting the largest face of the object therefore it blocking out more light creating a longer shadow. I think that the line graph would look similar to this: Apparatus 50 W bulb Retort stand Metre stick Object for creating a shadow (glue stick)
Investigating Octagon Loops
Investigating Octagon Loops Introduction I am primarily investigating Octagon Loops. In the investigation I plan to find out the relationship between the number of tiles used in the loop and the total number of free edges. Also, I will find the relationship between the number of tiles and the inside free edges and the number of tiles and the outside free edges. What I Will Do I plan to do this by first using octagon shapes and positioning them into loops, I will then put the results into a table so that it's easier to analyse. I'll start by making a loop with the least amount of shapes and then build up the number of shapes to give me a good range of values. Then I will analyse the results and hopefully discover some rules. What I did First of all I moved the octagon shapes around to find out the minimum amount it would take to make a loop. After discovering this (4) I made a table like the one in my results section and made more loops to get a more varied range of results which would make it easier for me to make a rule. I then set about trying to find out rules for the relationship between the 4 main aspects of the loops (number of tiles, inside free edges, outside free edges and total free edges). The diagrams page shows what shapes I made with the octagons to gather my results. Results My results for the octagon loops are shown below: No. Of Octagons Inside
A group of researchers set up a series of observation sites in the Arctic on a circumference of a circle of radius 50km.They need to set up a base camp so they can visit a different site each day.
Arctic Research Aim A group of researchers set up a series of observation sites in the Arctic on a circumference of a circle of radius 50km.They need to set up a base camp so they can visit a different site each day. Assumptions These are assumptions that can be made. . Altitude 2. Weather conditions 3. Air resistance 4. Plane speed constant 5. Wind speed constant throughout/No gust/Same direction 6. Time for turning around 7. Time for taking off and landing 8. Rotation of the Earth 9. Weight of fuel 0. Thermal 1. Safety 2. Breakdowns (damaged plane) 3. Plane could get damaged and not fly as well as before, result in less speed and longer journey time. Model 1 To start with a simple model would be for a plane to fly from A to B with no wind speed and ignoring all the assumptions as stated above. A 50 km B --------------------------------------------------------------------- Plane = 100 mph Wind speed = 0 = 100*1.6 = 160 kmh-1 Time = Distance/Speed = 50/160 = 18.75 minutes For the whole journey A to B then back to A would be: Time from A to B multiplied by 2. 2*18.75 = 37.5 minutes Equation Time (A to B to A) = 2(Distance/Speed) OR Time (A to B to A) = Total Distance/Speed Model 2 . Base at centre of the 360 degree circle 2. Wind speed 25kmh from the west 3. Plane travelling at a different speeds but with the same resultant (100kmh) 4. Same
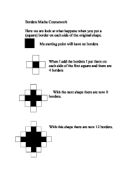
Borders Maths Coursework
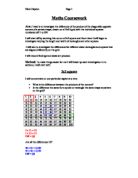
Borders Maths Coursework Here we are look at what happens when you put a (square) border on each side of the original shape. Me starting point will have no borders When I add the borders I put them on each side of the first square and there are 4 borders With the next shape there are now 8 borders. With this shape there are now 12 borders. This shape has 16 borders I can now see a pattern in the number of square, which is that there are 4 more each time. Here is a table to show what I have found. Number of black squares Number of white squares 4 5 8 3 2 25 6 41 20 61 24 Using this I can guess what the next number of white squares will be 20. A you can see there are 20 white cubes. This shape has 24 borders Now I will try to find the nth term for the white cubes (Borders). 1st 2nd 3rd 4th 5th 6th 4 8 12 16 20 24 4 4 4 4 4 The nth term for this is 4n so I wanted to work out how many borders there are the 10th shape I will times 4 by 10 and the number of borders will be 40 Now I will work out the nth term for all the squares in the pictures. Number of square 5 3 25 41 st 2nd 3rd 4th 5 13 25 41 st 8 12 16 2nd 4 4 The nth term for all the cubes is 22n-1. The 10th number will be worked out by 4 times 10 minus 1 which is

GCSE Maths Coursework - Shapes Investigation
GCSE Maths Coursework - Shapes Investigation Summary I am doing an investigation to look at shapes made up of other shapes (starting with triangles, then going on squares and hexagons. I will try to find the relationship between the perimeter (in cm), dots enclosed and the amount of shapes (i.e. triangles etc.) used to make a shape. From this, I will try to find a formula linking P (perimeter), D (dots enclosed) and T (number of triangles used to make a shape). Later on in this investigation T will be substituted for Q (squares) and H (hexagons) used to make a shape. Other letters used in my formulas and equations are X (T, Q or H), and Y (the number of sides a shape has). I have decided not to use S for squares, as it is possible it could be mistaken for 5, when put into a formula. After this, I will try to find a formula that links the number of shapes, P and D that will work with any tessellating shape - my 'universal' formula. I anticipate that for this to work I will have to include that number of sides of the shapes I use in my formula. Method I will first draw out all possible shapes using, for example, 16 triangles, avoiding drawing those shapes with the same properties of T, P and D, as this is pointless (i.e. those arranged in the same way but say, on their side. I will attach these drawings to the front of each section. From this, I will make a list of all
I have been given the equation y = axn to investigate the gradient function for varied values of "a" and "n".
I have been given the equation y = axn to investigate the gradient function for varied values of "a" and "n" Firstly I will choose n = 1 for varied values of a When n = 1 then the graph will be a straight line The general equation of a straight line is y = ax I am going to keep n constant and use varied values for "a".The gradient for a straight line remains the same, therefore I am going to calculate the gradient by taking the difference in the y co-ordinates divided by the difference in x co-ordinates. In order to calculate the gradient for a straight line we will have to go through the process of calculating the gradient by taking the difference in y co-ordinates divided by the difference in the x co-ordinates. I would then choose n = 2 for varying values of a where a = 1,2,3,4 The equations would be ; y = x2 , y = 2x2 , y = 3x2 , y = 4x2 These equations would get us curved graphs and the gradient function at each point in a curve is different therefore I will draw tangents using a capillary tube and calculate the gradient by taking the change in the value of the y co ordinates divided by the change in t value of the x co ordinates. I would then choose n = 3 for varying values of "a". The equations would be ; y = x3, y = 2x3,y = 3x3. Again these equations would get me curved graphs and I will establish a relationship Between the curve and the
Used Car PricesCourse Work Some of the factors which affect the price of a used car Age, Mileage, MPG, Colour, Engine Size
Used Car Prices Course Work Some of the factors which affect the price of a used car Age, Mileage, MPG, Colour, Engine Size, Fuel, Service History, Number of previous owners etc. I am going to concentrate on the following areas:- . Make - The manufacturers of the car e.g. ford, Mercedes etc. I think this affects the price of a used car because the price of the car when it is second hand depends on the popularity of that car, or whether the car is rare or not. For example I would expect a Bentley TurboR to go for more than a Ford Mondeo. 2. Age - I would expect older cars to go for less than newer ones because the older the car the less life it had left in it. 3. Mileage - I would expect a car with a lot of miles on it to be worn down a lot more than a newer one. Therefore I would expect it to go for a lot less than one with fewer miles on it. 4. Engine Size - I think that cars with a bigger engine have a tendency to be more appealing than cars with small engines. For example a 2.3 litre Volkswagen golf would go for more than a 1.6 litre Volkswagen golf 5. Colour - Sportier cars have a tendency to be painted fiery red or very intense bright yellow and they tend to appeal to younger boy racers. These tend to have very high insurance groups