The relationship between height and weight - Mayfield High School.
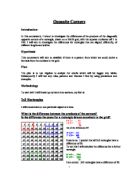
At a Mayfield High School Introduction This investigation is based upon the students of Mayfield High School, a fictitious school although the data presented is based on a real school. The total number of students in the school is 1183. Year Group Number of Boys Number of Girls Total 7 51 31 282 8 45 25 270 9 18 43 261 0 06 94 200 1 84 86 70 TOTAL 604 579 183 The line of enquiry I will choose will be the relationship between height and weight; I will use all of the students in school and begin by taking a random sample of 30 boys and 30 girls to see all the possible relationships. From the total number of students, I will choose 60 altogether. I will then analyse the sets of data I have in order to investigate the relationship between them. I will begin by taking a random sample of 60 students, 30 boys and 30 girls and record their heights and weights. I will choose 30 boys and 30 girls so that both genders are the same and the data I have chosen is fairer. The way I shall take a random sample is to use the random number button on my calculator. All the 1183 students are numbered from 1 to 1183. I will press the SHIFT button then the RAN# button in order to give a completely random number. The number displayed is between 0 and 1 and because I need a number between 1 and 1183, I will multiply the number displayed on the computer by the total

Geography Investigation: Residential Areas
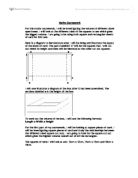
Residential Areas How do Basingstoke's residential areas change, improve and reflect different urban models? Applied Understanding For my geography coursework I am going to study the different types of residential areas throughout Basingstoke; working from the Central Business District and following the main route through Basingstoke in a south westerly direction. When my coursework is complete I am hoping to come up with a conclusion about whether Basingstoke follows the concentric model or if it fits more to the criteria of the sector model. The central place theory is a geographical theory that tries to explain the size and spacing of humans, however, this theory only works when certain criteria are met, which in reality, aren't met, for instance: an isotropic, limitless amount of space, an evenly distributed population, evenly distributed resources, consumers all have same purchasing power and no provider of goods can earn excess profit. The concentric ring model (also known as the Burgess Model) is slightly more realistic than the central place theory and is actually based on a city, Chicago, Illinois. The theory puts forward that a settlement grows evenly (see Figure 1 below) , with the CBD in the middle, then light manufacturing, working class housing, middle class housing and then on the outskirts of the settlement, the high-class housing. At this stage I can
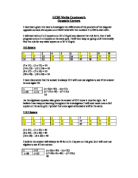
Conduct an investigation comparing height and weight from pupils in Mayfield School.
Noel Modarres Mathematics Coursework In this investigation, I have been given data from Mayfield School. Although the name of the school is likely to be fictional the data itself has come from real students. The data I have been given is for year 7 and year 11 students. There is information on around 170 students for each year. The following are the types of information we got on each student, year group, surname, forename, age, gender, hair colour, eye colour, which handed they are, favourite colour, favourite music, favourite sport, favourite subject, favourite T.V programme, average hours of T.V watched, IQ, height (m), weight (kg), distance travelled to school, Means of transport to school, number of siblings, number of pets, key stage two results for, maths, English and science. From the data I have received I have chosen to conduct an investigation comparing height and weight because I feel there much relevance between ones and height and weight. I have chosen to compare height and weight because I feel I will get clear results and therefore conduct a meaningful and knowledgeable investigation. I will be trying to determine whether ones height has any relevance to ones weight and then I will attempt to find out whether separating boys from girls will show different trends and in general have much difference from the group as a whole. I will first investigate

I would like to know whether there is a link between ability in Maths and in Science in the Year 7, 8 and 9 students at Mayfield High School.
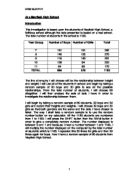
Introduction I would like to know whether there is a link between ability in Maths and in Science in the Year 7, 8 and 9 students at Mayfield High School. My initial thoughts are that there is a link between the two because Maths and Science share some of the same attributes - they both involve formulae, they both require logical ability, and they both use numbers. Furthermore, I think that someone with an interest in Maths will also have an interest in Science, and so will probably work hard at both. Data Collection To investigate this link, I will use the Key Stage 2 results from the Mayfield High School database. There are 813 Year 7, 8 and 9 students listed in the database, so to save time I will base my investigation on a sample of 30 of these students. Bias is anything that occurs when taking a sample that might prevent the sample from being a true representation of its parent population. To avoid bias, I will ensure that my selection of the sample is completely random. To ensure a random selection, I will use a random number generator on my calculator. In the database, the students are numbered from 1 to 813. As the random numbers appear on my calculator, I will record the associated data in two or three tables, once for all 30 students, one just for males and one just for females. I have decided to do this as I suspect that any link between ability in Maths
Data from Mayfield high school. It consists of 1183 people, split into 604 boys and 579 girls from the year groups 7-11. The information we've been provided contains a lot of information including: first name, surname, height weight, age, month
MAYFIELD HIGH SCHOOL Introduction For my investigation I'm going to use data from Mayfield high school. It consists of 1183 people, split into 604 boys and 579 girls from the year groups 7-11. The information we've been provided contains a lot of information including: first name, surname, height weight, age, month of birth, KS2 results etc. I have chosen to investigate the relationship between height and weight, as I feel they'll show a good relationship and may influence each other. I will investigate the following statements: * The relationship between height and weight and see how it varies within gender. * Compare the height to weight ratio in terms of body mass index. * Compare the height and weight between each of the year groups. Where the data can be found The data can be found on the school computers (located on the "W" drive, under MY COMPUTERS) I've chosen there sources of information because... I have chosen these sources of information, as the data is continuous and therefore there is a wide range of data and therefore I can make more predictions and hypothesis. The data is also quantative and so I can carry out my investigation even further. The data is reliable because: This data is reliable, as it has been taken from real people and therefore this data really exists and the values are not made up. (Anomalies are taken into account for, and are
Mayfield High School
Introduction I have chosen to compare the relationship between IQ and Key Stage 2 Results and my hypothesis is that the greater the person's IQ, the better their Key Stage 2 will be. I will use scatter graphs to represent my data and to find out if my hypothesis is true. For the scatter graphs I will be drawing the lines of best fit, finding the equations of these lines and using this to compare. I will also be using cumulative frequencies and box and whisker diagrams to look at the interquartile range and the median. If my hypothesis is true, I expect to see a positive correlation. Sampling the Database For my whole database I will use stratified samples, where the samples reflect the proportions of the whole population. Therefore, the school is growing and there are more students in year 7 than year 11. This means, there are likely to be more year 7 students in the sample than year 11 students. To ensure that students from different age groups are equally represented my need to take this type of my sample. In a stratified sample my sample values from a particular group in proportion to that group's size within the whole population. An example of a stratified sample in connection to Mayfield High School is shown below. For example, I want to make a population of 60 from the population of 1183 shown below from Mayfield High School. Year Group Number Of Boys Number
Assesment of Reading Difficulties in Patient AM Following the Development of Vascular Dementia.
Assesment of Reading Difficulties in Patient AM Following the Development of Vascular Dementia. ABSTRACT INTRODUCTION Dementia was defined by Cummings et al. (1980) as 'an acquired, persistent impairment of intellectual function with compromise and at least of the following spheres of activity: language, memory, visuospatial skills, emotion or personality and cognition.' Dementia occurs as a series of subtypes, one of which is known as vascular dementia (Brown, 1993). Vascular dementia is a disease which is most commonly caused by impairment to the circulatory system of the brain following damage caused by a stroke (Alzheimer, Scotland., 2002). Vascular dementia is found to be most prevalent in people aged 60-75 years and is more prevalent amongst the male population in comparison to female. Vascular dementia is seen to result in progressive deterioration of the higher functions of the brain for example memory, recognition, the ability to learn new information and fine motor movements (Alzheimer, Scotland, 2002). These changes commonly occur in a stepwise pattern due to the sudden occurrence of strokes. The features common to vascular dementia which characterise the disease include loss of memory and problems with forgetting recent events. The clarity of speech may alter resulting in difficulties in communicating. Patients may become poor at expressing

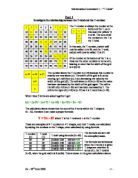
For my investigation I will be finding out patterns and differences in a number grid.
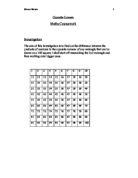
Introduction For my investigation I will be finding out patterns and differences in a number grid. An example of a number grid that I am going to use for my investigation is shown below. Columns 2 3 4 5 6 7 8 9 0 1 2 3 4 5 6 7 8 9 20 21 22 23 24 25 26 27 28 29 30 31 32 33 34 35 36 37 28 39 40 41 42 43 44 45 46 47 48 49 50 51 52 53 54 55 56 57 58 59 60 61 62 63 64 65 66 67 68 69 70 71 72 73 74 75 76 77 78 79 80 81 82 83 84 85 86 87 88 89 90 91 92 93 94 95 96 97 98 99 00 Rows As you can see I will draw a box on the number grid and multiply the top left number with the bottom right number in the box. I will then do the same for the top right and the bottom left number. Once I have the sum for each multiplication I will then find the difference between the two calculations. I will different size of boxes e.g. 2x2 and 3x3; these numbers represent the number of numbers there are across the side of box and on top of the box. An example of this would be 4x4 means there is 4 numbers on the side and 4 numbers on the top as shown below. 2 3 4 1 2 3 4 21 22 23 24 31 32 33 34 Multiply the top left number with the bottom right number then do the same, multiply the bottom left number with the top right number. After this take both calculations and minus them both from
Introduction to English language.
Introduction to English Language: Basic Concepts & Structures * Contents o Introduction & Outline Structure 2 o Morphology 3 Inflection and Derivation 3 Word Formation 4 o Closed & Open Word Classes 4 Problems of Classification 5 o Word Classes 6 Nouns & Articles 6 Pronouns 7 Verbs 8 Adjectives & Adverbs 9 Conjunctions 10 Prepositions 10 o Syntax 11 Noun Phrase 12 Adjective Phrase 13 Adverb Phrase 13 Prepositional Phrase 13 Verb Phrase 13 o Sentence & Clause 13 Clauses 14 Clause elements 14 Subject 14 Object 14 Verb 15 Complement 15 Adverbials 15 Vocatives 15 Clause Types 15 o Clause Function & Sentence Structure 16 Coordinate Clause 16 Subordinate Clause 16 Adverbial Clause 17 Adjectival Clause 17 o The Sentence 18 Sentence Types 18 Functions of the Sentence 18 Other Sentence Types 19 Structure & Style in the Sentence 20 * Introduction We can study the structure of language in a variety of ways. For example, we can study classes of words (parts of speech), meanings of words, with or without considering changes of meaning (semantics), how
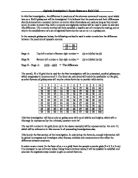
Algebra Investigation - Grid Square and Cube Relationships
Algebraic Investigation 1: Square Boxes on a 10x10 Grid In this first investigation, the difference in products of the alternate corners of a square, equal-sided box on a 10x10 gridsquare will be investigated. It is believed that the products and their differences should demonstrate a constant pattern no matter what dimensions are used; as long as they remain equal. In order to prove this, both a numeric and algebraic method will be used in order to calculate this difference. The numeric method will help establish a baseline set of numbers for testing, and to help in the establishment of a set of algebraic formulae for use on an n x n gridsquare. In the example gridsquare below, the following method is used in order to calculate the difference between the products of opposite corners. (a) (b) (c) (d) Stage A: Top left number x Bottom right number = (a) multiplied by (d) Stage B: Bottom left number x Top right number = (c) multiplied by (b) Stage B - Stage A: (c)(b) - (a)(d) = The difference The overall, 10 x 10 grid that is used for the first investigation will be a standard, cardinal gridsquare, which progresses in increments of 1. The formulae calculated will mainly be applicable to this grid, as other formats of gridsquares will require others formulae to provide valid results. 2 3 4 5 6 7 8 9 0 1 2 3 4 5 6 7 8 9 20 21 22 23 24 25