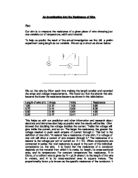
Ohms law actually states that if the cross-sectional of the wire is uniform then the resistance is proportional to the length (if you double one, you double the other) and inversely proportional to the area of the cross section (if you double the cross sectional area, you halve the resistance).
Ohm’s law states that:
V= I*R
R=V/I
I=V/R
V= voltage applied in volts (V)
I= current in amperes (A)
R= resistance of the circuit (Ω)
The resistance of a wire will depend on it shape and size. The longer the wire is the greater the resistance so the smaller the wire the smaller the resistance will be, provided that the wire is the same thickness and material. The thicker the wire is, then the smaller the resistance is so the thinner the wire is the greater the resistance would be. The material of a wire also affects the resistance.
Ohm’s law also states that to find the resistivity of the wire / specific resistance of the cross sectional area you do:
ρ= RC/L
ρ= resistivity of the wire (rho)
R= resistance of the wire
C= cross sectional area (thickness)
L= length of the wire
The resistivity is the resistance per unit length of a piece of material of cross sectional area 1m².
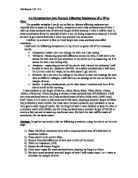
Pilot Investigation
Preliminary Experiment for length
Diagram
A
= main power = variable resistor
= ammeter = wire
= voltmeter = crocodile clip
Apparatus
The apparatus that I will need to do this experiment are:
- A voltmeter
- An ammeter
- 5 wires
- 2 crocodile clips
- Power pack
- Rheostat (variable resistor)
- Sellotape
- Ruler
Method
A pilot investigation was done before to see the relationship between length and resistance in different wires.
First by setting up the apparatus as shown below in the diagram. With the voltmeter parallel to the wire and the ammeter in series with the wire.
Step 1 Cut 110cm of the wires E26 (more than 100cm because extra wire is needed to clip the crocodile clips too). When doing this use two rulers side by side start from measuring at the 10cm mark all the time.
Step 2 Sellotaped the E26 wire to the ruler at one end with a little wire extra from the ruler. This is to hold it still so that it would be easier to measure the length of the wire accurately.
Step 3 Straighten the wire and measure to 100cm exactly and put a piece of sellotape edge exactly on the mm of 100cm. So that when the wire taken off the ruler the sellotape would still be attached to it.
Step 4 Clip the crocodiles clips exactly to the edge of the sellotape on the wire. The wire that is not in between the two crocodile clips will get no electricity flowing through it because they are not part of the circuit.
Step 5 Check that all the wires were connected properly to the other apparatus and then turn on the mains power and recorded the voltage and current for that length of that wire. Take 5 readings for each length of wire.
Step 6 Then repeat steps 2-5 again but for the following lengths 95cm, 90cm, 80cm, 70cm, 60cm, 50cm, 40cm, 30cm, 20cm, 10cm (stop at 10cm because the wire would be too short and it would start to heat up and would soon break). Adjust the length by moving the second crocodile clip, keeping the first crocodile clip in place at the 10cm mark.
Step 7 Then repeat steps 1-6 again but for the following wires E28 and E32.
Factors
In this experiment there was one variable which was not controlled and that was the length of the wire. But all the rest stay constant and they were:
- The thickness of the wire (by using the same wire throughout the experiment).
- The temperature (this was achieved by not turning the circuit on unless I have to as to keep the temperature of the wire as close to room temperature as possible and waiting for a few minutes before I take my next reading to let the wire cool down).
- The same voltage was used throughout the experiment.
- The same apparatus-for example voltmeter, an ammeter, wires, variable resistor, power pack and crocodile clips.
- The same ruler was used to measure the wire each time.
Safety
In this experiment I made sure before I started that there was no water around my apparatus because it is very dangerous. I also checked for fault in the circuit before I start as well because that could also be dangerous. When there was a current running through the circuit and there were exposed wires for example the clips I did not touch them because this could be very dangerous because there is electricity going through them. I also did not touch the experiment wire because it could be hot due to the current and I could have included a switch in my circuit so that I can break the circuit quickly if I needed to. I made sure that my bag was underneath the table as well so they are not in the way of other people.
Accuracy with the equipment
In order to reduce errors it is necessary to choose accurate and reliable equipment. But the only equipment that were available for us to use at the time we the normal ammeter and volt meter which are not as accurate as the multi meters. Because the normal ammeters and volt meters only give the reading to two decimal places whereas the multi meters can give up to three decimal places which means its more accurate than the normal meters.
The results were;
In the wire E32
In the wire E28
In the wire E26
So this experiment shows me that E32 has the highest resistance of the three wires. This is because it has a smaller cross sectional area than the other wires. The thicker the wire is, the lower the resistance so the thinner the wire is the higher the resistance. So because E26 has the largest cross-sectional area out of the three this would mean that it has a lower resistance than the other two wires. In the table it also shows that length is proportional to the resistance because if you double the length you double the resistance. For example 50cm on the E32 wire has the resistance of 4.41 Ohms and in the length 100cm it has the resistance of 8.56 Ohms.
This shows me that if I am going to investigate in the relationship between the length and the resistance I will need a larger range of lengths to get a more accurate result.
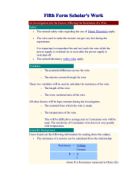
Main Experiment
Investigating in the factor length
From my preliminary experiment I decided to do the main experiment which just one wire E28 but investigating more lengths than the preliminary one. I chose E28 because it has the average cross sectional area out of three wires I investigated in.
Prediction
I predict that if I double the length of the wire then the resistance will also double. I mean that if I double the length of the wire there will be twice as many electrons in the wire to carry the charge. So twice as many metal ions for the electron to collide into so it will cause two times the resistance than the original length of the wire which will result in a greater resistance.
Diagram
A
= main power = variable resistor
= ammeter = wire
= voltmeter = crocodile clip
Apparatus
The apparatus that I will need to do this experiment are:
- A voltmeter
- An ammeter
- 5 wires
- 2 crocodile clips
- Power pack
- Rheostat (variable resistor)
- Sellotape
- Ruler
Method
I learnt from my pilot investigation that I need to do extra readings in order to obtain a set of accurate results. First by setting up the apparatus as shown below in the diagram. With the voltmeter parallel to the wire and the ammeter in series with the wire.
Step 1 Cut 110cm of the wire E28 (not 100cm because extra wire is
needed to clip the crocodile clips too). When doing this use two rulers side by side start from measuring at the 10cm mark all the time.
Step 2 Sellotaped the E28 wire to the ruler at one end with a little wire extra from the ruler. This is to hold it still so I could measure
the length of the wire accurately.
Step 3 Straighten the wire and measured to 100cm exactly and put a piece of sellotape edge exactly on the mm of 100. So that when the wire taken off the ruler the sellotape would still be attached to it.
Step 4 Clip the crocodiles clips exactly to the edge of the sellotape on the wire. The wire that is not in between the two crocodile clips will get no electricity flowing through it because they are not part of the circuit.
Step 5 Check that all the wires were connected properly to the other apparatus and then turn on the mains power and recorded the voltage and current for that length of that wire. Take 5 readings for each length of wire.
Step 6 Then repeat steps 2-5 again but for the following lengths 95cm, 90cm, 85cm, 80cm, 75cm, 70cm, 65cm, 60cm, 55cm, 50cm, 45cm, 40cm, 35cm, 30cm, 25cm, 20cm, 15cm, 10cm (stop at 10cm because the wire would be too short and it would start to heat up and would soon break). Adjust the length by moving the second crocodile clip, keeping the first crocodile clip in place at the 10cm mark.
Factors
In this experiment there was one variable which was not controlled and that was the length of the wire. But all the rest stay constant and they were:
- The thickness of the wire (by using the same wire throughout the experiment).
- The temperature (this was achieved by not turning the circuit on unless I have to as to keep the temperature of the wire as close to room temperature as possible and waiting for a few minutes before I take my next reading to let the wire cool down).
- The same voltage was used throughout the experiment.
- The same apparatus-for example voltmeter, an ammeter, wires, variable resistor, power pack and crocodile clips.
- The same ruler was used to measure the wire each time.
Safety
In this experiment I made sure before I started that there was no water around my apparatus because it is very dangerous. I also checked for fault in the circuit before I start as well because that could also be dangerous. When there was a current running through the circuit and there were exposed wires for example the clips I did not touch them because this could be very dangerous because there is electricity going through them. I also did not touch the experiment wire because it could be hot due to the current and I could have included a switch in my circuit so that I can break the circuit quickly if I needed to. I made sure that my bag was underneath the table as well so they are not in the way of other people.
Accuracy with the equipment
In order to reduce errors it is necessary to choose accurate and reliable equipment. But the only equipment that were available for us to use at the time we the normal ammeter and volt meter which are not as accurate as the multi meters. Because the normal ammeters and volt meters only give the reading to two decimal places whereas the multi meters can give up to three decimal places which means its more accurate than the normal meters.
Results
For the wire Eureka 28
Analysis
It can be seen from the table of results (above) and the graph of the relationship between length and resistance that as the length increases, the higher the resistance is. However the graph is not a curve so the two qualities (length and resistance) are directly proportional.
Direct proportion means that doubling the length would double the resistance and you can see it is true. It can be seen from the table that the length of 50cm gives the resistance of 2.3 Ohms and double the length 100cm gives the resistance of 4.6 Ohms.
Ohm’s law actually states that the current flowing through the circuit is directly proportional to the applied voltage (if you double one, you double the other).
Also electrons colliding into metal ions causes’ resistance. So if the length of the wire is double, the electrons will collide into twice as many ions so there will be twice as much resistance. This happens because of the electrons that flow through the wire.
These electrons travel at a steady pace, when they come to different piece of wire, they have to slow down in order to be able to pass (different wire meaning the actual wire being used and the wires connecting the apparatus). While moving through the wire, the electrons need to squeeze together.
This is because there is not enough room/space for them to pass evenly through the wire. The more the electrons have collided into each other then the higher the resistance is. This is because it will take the electrons longer to pass from one end of the wire to the other end. This is because the current is slowed down. The longer the wire, the longer the electrons have to stay squashed together and so the longer they take to pass through the wire and therefore the higher the resistance is.
The results lie on a straight line, which means there is a positive pattern. The length that was 0cm had no resistance because there was no wire and therefore the circuit would be broken so there will be resistance.
As the length of the wire increases the resistance increases because the wire is longer so the electrons will collide into more metal ions and that will lead to a higher resistance. So as the length keeps increasing the electrons are colliding into more metal ions and so the resistance gets greater and greater.
The resistance of the wire was worked out by using the formula:
V/I=R
There were no anomalous results which mean the experiment was overall very accurate as the points lie very close to the best fit line.
My results supported my prediction that if I double the wire the resistance will double.
Evaluation
The measurements taken in the experiment were simple and straightforward and I could over half an hour obtain a set of results, which showed a definite pattern.
Most of the result lies on the straight line or very near the straight line and there were no anomalous results. So this means this set of results is fully reliable and it supports my prediction earlier giving a positive pattern result. But the reliability of the evidence can still be improved. From my results I work out the accuracy of my results to see how accurate I was. This was done by taking the range of resistance (how much above or below the average resistance) and dividing that by the average resistance then multiplying it by 100% to get the percentage error. An example is shown below for one length of the E28 wire.
E28 at the length of 100cm. The average resistance is 4.57 Ohms and the range is 4.57±0.07 Ohms. Too work out the percentage error the following is done:
0.07 × 100% = 1.5%
4.7
So E28 with the length of 100cm has the percentage error of 1.5%
The rest of the results and their percentage errors are shown in the following table.
From the calculation on the page before it can be seen that the experiment was overall very accurate. The percentage error is under 5.7%. But all of them are under 2.4% part form the 10cm length this could be that the length was very short and the wire may have started to heat up causing the resistance to be higher. But it still shows that the results are reliable.
Improvements
- I could have repeated the experiment for each length ten times instead of five times. This was making the results not only more reliable but it also makes it more accurate because the more readings I take the less error there is. So it reduces the probability of having errors.
- Redo the experiment but this time has more lengths maybe going up in 2cm instead of 5cm or investigate in more lengths say go up 200cm instead of 100cm.
- I could have measured my lengths even more accurately by repeating it again, so three times instead of two times. To reduce error when measuring the length I could measure it between to points. So don’t start to measure it from 0cm because that may not be as accurate as the ruler could be wore away at the end which means the length that is measured is shorter than it is. This would mean I be able to plot a more accurate graph than the one I done for this experiment.
- Instead of using normal ammeter and volt meter use multi meters instead because they give a more accurate reading than the normal ammeters and volt meters. The multi meters give their reading to three decimal places whereas the normal ammeters and volt meters only give reading to two decimal places.
- I could have extended the investigation more by finding how the cross-section area (thickness), material in wire (e.g. copper) and the temperature also affected the resistance of the wire to make my result more reliable. Although investigating the factor with temperature is very hard because with temperature it’s very hard to control the temperature you want it to be. So the reading tends not to be as accurate and many errors could occur in an investigation for this. More errors would occur are in this experiment investigating with temperature than the other factors.
Preliminary Investigation for Cross Sectional Area
From the experiments I did with length I learnt that using normal volt meter and ammeter are not as accurate as using multi meter. Because the normal volt and ammeter give the reading to two decimal places whereas the multi meter can give readings up to three decimals places which is more accurate. So in the following experiment I decided to use the multi meter instead of the normal volt meter and ammeter.
I decided to use a potential divider because there is a larger range of voltages available which means the current varies more.
Diagram
= Main power supply = variable resistor
= Multi meter = wire
= Multi meter = crocodile clip
Apparatus
The apparatus that I will need to do this experiment are:
- 2 Multi Meters
- 7 Wires
- 2 Crocodile clips
- Power pack
- Rheostat (variable resistor)
- Sellotape
- Ruler
- Micrometer
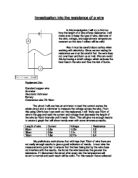
Method
I learnt from my pilot investigation and main experiment for the length is that by extending the investigation it would be best to investigate the how the cross sectional area of a wire affects the resistance. First by setting up the apparatus as shown below in the diagram. With the voltmeter parallel to the wire and the ammeter in series with the wire.
Step 1 Cut 50cm of the wires E26 (more than the length needed
because extra wire is needed to clip the crocodile clips too).
Step 2 Use a micrometer to measure the diameter of the wire. Measure the width of the wire in five different places evenly spread out on the wire and record the reading. Make sure that the micrometer starts on zero or there be a zero effect to the final result.
Step 3 Sellotaped the E26 wire to the ruler at one end with a little wire extra from the ruler. This is to hold it still so that the length can measure accurately.
Step 4 Straighten the wire and put the crocodile clip on 20cm. Put the centre of the crocodile clip on the 20cm mark on the wire and then put the centre of the other crocodile clip on the 40cm mark on the wire. The wire that is not in between the two crocodile clips will get no electricity flowing through it because they are not part of the circuit.
Step 5 Check that all the wires were connected properly to the other apparatus and then turn on the mains power and recorded the voltage and current for that length of that wire. Take 5 readings for each length of wire.
Step 6 Then repeat steps 1-5 again but for the following wires E28, E30, E32, E34, and E36.
Factors
In this experiment there was one variable which was not controlled and that was the cross sectional area of the wire. But all the rest stay constant and they were:
- The length of the wire (by using the same length of wire throughout the experiment).
- The temperature (this was achieved by not turning the circuit on unless I have to as to keep the temperature of the wire as close to room temperature as possible and waiting for a few minutes before I take my next reading to let the wire cool down).
- The same voltage was used throughout the experiment.
- The same apparatus-for example multi meters, wires, variable resistor, power pack and crocodile clips.
- The same ruler was used to measure the wire each time.
Safety
In this experiment I made sure before I started that there was no water around my apparatus because it is very dangerous. I also checked for fault in the circuit before I start as well because that could also be dangerous. When there was a current running through the circuit and there were exposed wires for example the clips I did not touch them because this could be very dangerous because there is electricity going through them. I also did not touch the experiment wire because it could be hot due to the current and I could have included a switch in my circuit so that I can break the circuit quickly if I needed to. I made sure that my bag was underneath the table as well so they are not in the way of other people.
Accuracy of the equipment
In order to reduce errors it is necessary to choose accurate and reliable equipment. I decided to use crocodile clips instead of jockies because although jockies are more accurate cause there can pin point the exact spot but he hard to keep them in the same place throughout the experiment. Because you have to hold them in place and if you doing that you can’t do the experiment at the same time. Also it might not be in the same place throughout the experiment so it would not be a fair experiment.
By measuring the length of the wire from 20cm means that I would reduce the error of having reading error such as if I took the length from 0cm then there a possibility of having the error that the length is shorter than it is because the end of the ruler could have been wore away so it may not start on 0cm exactly.
The micrometer gives the readings with a precision of ±0.01mm. Also when measuring with the micrometer with the gap closed, the reading ought to be zero, if not the zero reading must be taken into account when measuring the gap width. So there could be a possibility of a zero effect on the results.
When using multi meters because it can be set for different ranges according to the situation. Each range has a different sensitivity e.g. when a multi meter range voltmeter is used; the correct range to use is the one that gives the biggest readings on the meter scale without overloading the scale. Also before starting the experiment the multi ammeter and multi voltmeter must be checked to read zero before use to ensure they read zero when disconnected or this will affect the final result.
Results
All the wire had a fixed length of 20cm.
So this preliminary experiment shows me that as the cross sectional area of the wire decreases the resistance increases E36 has the highest resistance of the six wires. This is because it has a smaller cross sectional area than the other wires. The thicker the wire is, the lower the resistance so the thinner the wire is the higher the resistance. So because E26 has the largest cross-sectional area out of the six this would mean that it has a lower resistance than the other five wires. In the table it also shows that cross sectional area is inversely proportional to the resistance because if you half the cross sectional area you double the resistance. For example E26 has the cross sectional area of 0.17mm² and the resistance is 0.668 Ohms whereas E30 is half the cross sectional area of E26 (0.08mm²) and it has the resistance of 1.409 Ohms which is twice as much resistance of E26.
This shows me that if I am going to investigate in the relationship between the cross sectional area and the resistance I will need a larger range of readings in order to get a more accurate and reliable result and a larger range of wires. I could also investigate the wires E22 and E24.
Main experiment
Investigating the factor cross sectional area
Diagram
= Main power supply = variable resistor
= Ammeter = wire
= Voltmeter = crocodile clip
Method
I learnt from my pilot investigation and main experiment for the cross sectional area is that by extending the investigation it would be best to investigate the how the cross sectional area of a wire affects the resistance.
First by setting up the apparatus as shown below in the diagram. With the voltmeter parallel to the wire and the ammeter in series with the wire.
Step 1 Cut 50cm of the wires E22 (more than the length needed
because extra wire is needed to clip the crocodile clips too).
Step 2 Use a micrometer to measure the diameter of the wire. Measure the width of the wire in five different places evenly spread out on the wire and record the reading. Make sure that the micrometer starts on zero or there be a zero effect to the final result.
Step 3 Sellotaped the E22 wire to the ruler at one end with a little wire extra from the ruler. This is to hold it still so that the length can measure accurately.
Step 4 Straighten the wire and put the crocodile clip on 20cm. Put the centre of the crocodile clip on the 20cm mark on the wire and then put the centre of the other crocodile clip on the 35cm mark on the wire. The wire that is not in between the two crocodile clips will get no electricity flowing through it because they are not part of the circuit.
Step 5 Check that all the wires were connected properly to the other apparatus and then turn on the mains power and recorded the voltage and current for that length of that wire. Take 10 readings for each length of wire.
Step 6 Then repeat steps 1-5 again but for the following length 30cm again making sure that the centre of the first crocodile clip is on the 20cm mark and the second crocodile clip on the 50cm mark.
Step 7 Then repeat steps 1-6 again but for the following wires E22, E28, E30, E32, E34, and E36.
Factors
In this experiment there was one variable which was not controlled and that was the cross sectional area of the wire. But all the rest stay constant and they were:
- The length of the wire (by using the same length of wire throughout the experiment).
- The temperature (this was achieved by not turning the circuit on unless I have to as to keep the temperature of the wire as close to room temperature as possible and waiting for a few minutes before I take my next reading to let the wire cool down).
- The same voltage was used throughout the experiment.
- The same apparatus-for example multi meters, wires, variable resistor, power pack and crocodile clips.
- The same ruler was used to measure the wire each time.
Safety
In this experiment I made sure before I started that there was no water around my apparatus because it is very dangerous. I also checked for fault in the circuit before I start as well because that could also be dangerous. When there was a current running through the circuit and there were exposed wires for example the clips I did not touch them because this could be very dangerous because there is electricity going through them. I also did not touch the experiment wire because it could be hot due to the current and I could have included a switch in my circuit so that I can break the circuit quickly if I needed to. I made sure that my bag was underneath the table as well so they are not in the way of other people.
Results
The table below show the diameters of the wire and the tables on the following pages show the voltage and current obtained from the experiment with the resistance work out.
E22 wire with the length at 15cm
E26 wire with the length at 15cm
E28 wire with the length at 15cm
E22 wire with the length at 30cm
E26 wire with the length at 30cm
E28 wire with length at 30cm
E30 wire with the length at 15cm
E32 wire with the length at 15cm
E34 wire with the length at 15cm
E30 wire with the length at 30cm
E32 wire with the length at 30cm
E34 wire with the length at 30cm
E36 wire with the length at 15cm
E36 wire with the length at 30cm
Analysis
From the table of results there is a clear pattern showing that the length and resistance of a wire are linked together. The two qualities (length and resistance) are directly proportional to each other. This means doubling the length would double the resistance. It can be seen from the table for each type of wire that at the length of 30cm the resistance is double of the wire at the length of 15cm. For example from the table it can be seen for the wire E22 the resistance is 0.324 Ohms at the length 15cm and the resistance is then doubled 0.611 Ohms when its 30cm. This extension to the experiment was done to prove that the length is still directly proportion to the resistance for each different cross sectional area a wire. The experiment investigating in the length of a wire is shown in the preliminary experiment.
Ohm’s law actually states that the current flowing through the circuit is directly proportional to the applied voltage (if you double one, you double the other). The electrons colliding into metal ions causes’ resistance. So if the length of the wire is doubled, the electrons will collide into twice as many ions so there would be twice as much resistance due to the electrons that flow through the wire. These electrons travel at a steady pace, when they come to different piece of wire, they have to slow down in order to be able to pass (different wire meaning the actual wire being used and the wires connecting the apparatus). While moving through the wire, the electrons need to squeeze together. This is because there is not enough room/space for them to pass evenly through the wire. The more they squeeze together to get through increases the chance of the electrons colliding into each other then the higher the resistance would be. The resistance also increases because it will take the electrons longer to pass from one end of the wire to the other end because the current is slowed down. The longer the wire, the longer the electrons have to stay squashed together so they are more likely collide into each other and it takes longer for the electrons to pass through the wire so the longer it takes the chances of having collisions with the metal ions increases therefore the higher the resistance would be.
As the length of the wire increases the resistance increases because the wire is longer so the electrons will collide into more metal ions and that will lead to a higher resistance. So as the length keeps increasing the electrons are colliding into more metal ions and so the resistance gets greater and greater.
So from the results I then decided to plot a graph to show the relationship between the cross sectional area of a wire and the resistance. In order to do this I had to work out the area of each wire. The results are shown below in the table. The first graph (graph 1) I plotted was the resistance against the cross sectional area of a wire at the fixed length of 15cm. The second graph (graph 2) was the same showing the resistance against the cross sectional area of a wire but at the fixed length of 30cm. I decided to plot both graph to show that the final result should be the same for both graphs. However the graph is not a straight line so that suggests the two qualities (cross sectional area of a wire and resistance) are not directly proportional to each other. So then I decided to plot resistance against 1/cross sectional area of a wire (graph 3) at the fixed length of 15cm and a graph (graph 4) with the fixed length of 30cm. In order to plot this graph I had to work out 1/cross sectional area of a wire. The results are shown below in the table.
The graph was a straight line so that meant the cross sectional area of a wire is inversely proportional to the resistance of a wire. This means the greater the cross sectional area of a wire is (thickness), the more electrons the are available to carry the charge along the wire length so the lower the resistance is. From the results it can be seen that as the cross sectional area of the wire decreases the resistance of the wire increases. So as you double the cross sectional area of the wire the resistance of the wire halves. For example the cross sectional area of E36 is 0.028mm² and double the cross sectional area of that is E34 which is 0.042mm². So that means the resistance of E34 should be half of the resistance of E36. The resistance of E34 at the fixed length of 15cm is 1.847 Ohms and the resistance of E36 is 2.822 Ohms. This shows that’s as you double the cross sectional area of a wire the resistance of the wire will be halved.
The electrons colliding into metal ions causes’ resistance. So if the cross sectional area of a wire is doubled, the electrons won’t have to squeeze together as much to pass through the wire so the electrons have half the chance of colliding into the metal ions so the resistance is halved. These electrons travel at a steady pace, when the cross sectional area of the wire increases there is more room for the electrons to pass through. The electrons are further apart from each other and from the metal ions which means that they are less likely to collide into each other so the resistance is less.
So from the results it can be seen that as the cross sectional area of the decreases the resistance increases because the electrons passing through the wire have less room to go through so the electrons have to squash together which means they are more likely to collide into each other. So that means the resistance of the wire increases because the electrons are colliding more with the metal ions as there is less room for them to move.
My results support my prediction that if I double the length of the wire the resistance would double and if I double the cross sectional area of the wire the resistance would halve.
From that I then decided to work out the resistivity of the Eureka wire. To do this I have to use the formula:
ρ= RC/L
ρ= resistivity of the wire (rho)
R= resistance of the wire
C= cross sectional area (thickness)
L= length of the wire
So I decided to work out the resistivity for all the wires (E22, E26, E28, E30, E32, E34, and E36) then take an average of them for both lengths together. The results should be the same or nearly the same. The resistivity of Eureka constantan (quote from the Understanding Physics for Advanced Level by Jim Breithaupt) is 5.0 × 10⁻⁷. To do this I will use the formula above. An example is show below the rest of the working is show in a table after the example.
ρ= RC/L
ρ = 0.324 × (2.5 × 10-7)
0.15
ρ = 5.4 × 10⁻⁷ Ωm
The rest of the working out is in the table below.
The average resistivity for the Eureka from my result was 5.3× 10⁻⁷ which is slightly bigger than the value given 5.0 × 10⁻⁷. But it is still very close to the actual value. Which means my result is quite accurate.
Evaluation
The measurements taken in the experiment were simple and straightforward and I could over two double lessons (about two hours) obtain a set of results, which showed a definite pattern.
All of the results lie on the straight line or very close to the line. If there were any anomalous results. I would have redone that part of the experiment again to check that the results were right. But I did not have any anomalous results so I did not need to do that. So because I did not have any anomalous results that meant my results could be reliable because it supports my prediction earlier and it gives a positive pattern result.
From my results I first work out the accuracy of my results to see how accurate I was.
Cross Sectional Area- This was by taking the range of diameter (how much above or below the average diameter) and dividing that by the average diameter then multiplying it by 100% to get the percentage error in the diameter. Then to get the percentage error in the cross sectional area the percentage error in the diameter is multiply by 2.
The following table show the percentage error for all the diameter and cross sectional area in different types of wire.
From the calculations above it can seen that measuring the diameter of the wire was overall very accurate. The percentage error is under 0.43% which is very accurate for this experiment. This means my results are fully reliable.
Resistance-This was done by taking the range of resistance (how much above or below the average resistance) and dividing that by the average resistance then multiplying it by 100% to get the percentage error. An example is shown below just for both lengths of the E22 wire.
E22 at the fixed length of 15cm. The average resistance is 0.324 Ohms and the range is 0.324±0.004 Ohms. Too work out the percentage error the following is done:
0.004 × 100% = 1.23%
0.324
So E22 with the fixed length of 15cm has the percentage error of 1.23%
E22 at the fixed length of 30cm. The average resistance is 0.611Ohms and the range is 0.611±0.003 Ohms. Too work out the percentage error the following is done:
0.003 × 100% = 0.49%
0.611
So E22 with the fixed length of 30cm has the percentage error of 0.49%
The rest of the results and there percentage error is shown in the following tables.
The following table show the percentage error for all the different types of wire at the fixed length of 15cm.
The following table show the percentage error for all the different types of wire at the fixed length of 30cm.
From the calculations above it can seen that the experiment was overall very accurate. The percentage error is under 1.26% which is very accurate for this experiment. This means my results are fully reliable.
Resistivity- I then decided to work out the percentage error in the resistivity by taking the range of the resistivity (how much above or below the average resistivity) and dividing that by the average resistivity then multiplying it by 100% to get the percentage error.
5.3 × 10⁻⁷ ± 0.7 × 10-7 = 13.2%
So there was a 13.2% error in the resistivity this is because the resistivity is a value calculated from value which already has an error. So this means the resistivity would have a larger error because it the sum of the length, cross sectional area, voltage, current and resistance altogether.
I could have extended the investigation more by finding how the material in wire (e.g. copper) and the temperature also affected the resistance of the wire to make my result more reliable.
Bibliography
Understanding Physics for Advanced Level by Jim Breithaupt
Physics for You
Accessible Physics
Physics Applied