Here is one example,
“Suppose that the length of a given wire is doubled. This doubles the resistance, since twice the length of wire is equivalent to two equal resistances in series… The resistance of a wire is therefore proportional to its length.” (Ordinary Level Physics)
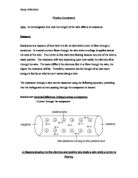
For the variable of cross-sectional area, I predict that as the wire increases in cross-sectional area, the resistance will decrease. Therefore the resistance of the wire would be inversely proportional to its cross-sectional area. A good analogy of this is liquid being poured into a bottle. At the neck of the bottle it is thinner, the liquid flows through it more slowly, so there is more resistance. But where the cross-sectional area of the bottle is larger, the liquid flows quicker as there is less resistance.
When the material of the wire is varied, I predict that the resistance will be in direct proportion to the material. The resistance of the wire depends on resistivity- the property of the wire. The resistance of a 1 metre length of material with a cross-sectional area of 1 square metre is equal to the resistivity. This is measured in Ohm-metres (Ωm) So, I think that wires with a higher resistivity will have a higher resistance when compared to wires with a low resistivity, which will have a lower resistance.
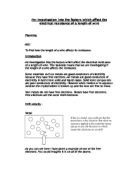
I predict that when the temperature of the wire is varied, and the temperature increases, as will the resistance. I foresee this because when the temperature builds up, the atoms of the metal vibrate more vigorously due to the boost in energy. This means that the electrons have greater difficulty getting through the wire, as the collisions are more frequent. Therefore there will be more resistance.
Experiment
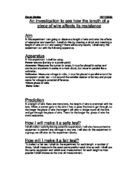
Diagram:
I will set up the circuit, as shown above, using an ammeter, power supply, voltmeter, rheostat and the test wire. Using crocodile clips, I will attach the first 10 cm’s of test wire to the main circuit and record the current and voltage. I shall do this twice more, moving the rheostat further along each time, recording all the results as I go along. To calculate the resistance, from each three readings, for each measurement of test wire, I will need to divide the voltage by the current. Then I will work out the average resistance for each measurement of wire, by adding the results together and dividing the answer by three (as that is the number of figures being added together). I will repeat this procedure, moving the crocodile clips along another 10 cm’s at a time, up to 100 cm’s.
Fair Test
To keep this a fair experiment, the only variable will be the length of wire being tested; all other factors shall remain constant. This will be accomplished by using the same piece of wire throughout and the temperature kept the same (room temperature) as much as possible. All equipment will stay the same for the entire experiment, to prevent errors, and for safety reasons, the wire will not be touched when current is flowing as it may begin to heat up.
Results
A table to show the results I obtained from the experiment.
From these results, I found the resistance for each of the three values by dividing the voltage by the current.
A table to show the results of my calculations.
Graph 1: A Graph to show the resistance of different lengths of the same wire.
Graph 2: A Graph to show the relationship between the resistance and length of wire.
Conclusion
Graph 2 shows a positive correlation between the resistance and length of the wire. This demonstrates that my prediction was correct; an increase in length, gives an increase in resistance and it is in direct proportion. It can be made clear why this happens by the fact that free electrons are knocking into ions, in the wire, around the circuit. Every time this happens, the electrons lose energy in the form of heat, causing the flow to slow down. Therefore, if the number of collisions between electrons and ions are directly proportional, then the longer the length of wire, the more resistance there is.
This can be written as the equation:
R = KL
It shows that the resistance (R) is in direct proportion to the length of wire (L), and K is the gradient of the straight line on graph 2.
Evaluation
In general, I think my results are quite accurate because they formed good straight lines on both graphs. There are some very, very small irregular results that don’t quite fit, but this is probably due to the wire heating up during the experiment. As temperature is one of the factors, this explains why the outcome for the resistance has these few tiny anomalous results.
I tried to reduce the amount of mistakes in the experiment by taking several readings for each measurement of wire, the current and voltage. Then I calculated the averages of resistance to help maintain reliable and accurate results.
In my opinion the apparatus I chose, measurements I used and even the variable chosen worked well. Even though there were one or two very slight possible faults, I still think that the complete results were acceptable and reliable. They showed how my prediction was correct in that resistance is directly proportional to length, so the results were obviously good enough to be able to show that.
Finally, all the evidence supports what I have said, so I think that the overall experiment was quite successful.