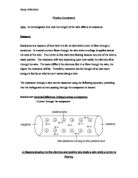
Resistance is measured in Ohms. An Ohm is a measurement of the potential difference (volts) divided by the current (amps). This can be written in a formula triangle:
V
I R
Ohms Law states that the current (I) is directly proportional to the voltage (V) applied if the temperature does not vary. As the voltage across a conductor is increased the electric current running through it increases in proportion. For any metal conductor at a constant temperature the resistance (R) is the same, it is not dependant on the current. Any type of conductor which has any amount of resistance gives off heat when a current is passed through it (Joule’s Law).
Resistance varies with the type of material used, the length of the wire, the temperature of the wire and the diameter (wires have circular cross sections). A long, thin wire has a higher resistance than a shorter, thicker wire. This is because in a thin wire the electrons are more restricted as they have less room to ‘travel’ in so they are slowed down, whereas in a thick wire there are no restrictions and the electrons can travel freely. If a circuit has a high resistance it will carry less current which means that the current in a circuit can be altered by increasing or decreasing the current. If a wire has a high temperature it will have a different resistance to the same wire with a low temperature. Different materials are better conductors of electricity than others.
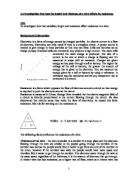
Resistance occurs when the atoms in the metal obstruct the path of the flowing electrons and collide with them. So when there are more atoms to collide the resistance has been increased. When you double the length of a wire, you double the amount of atoms which can collide with the electrons. This is also why a thicker piece of wire has a lower resistance than a thinner piece.
Resistors and the application of Ohms Law are used in many household appliances. Any appliance, which uses electricity to generate heat, uses the principle of resistance. An electric kettle uses an immersion heater which is an electrical heating element surrounded by insulating material in a thin metal casing.
A light bulb has a resistance which draws current from the power supply which causes the element to grow incandescently which generates heat and light. By the same principles, a wire can get heated in a circuit because the electrons are vibrating as they are moving. The vibrations generate heat which is passed along the wire.
PLANNING
For all of my experiments I will need:
nickel chrome wire,
a power supply,
several connecting wires (two with crocodile clips),
an ammeter,
a voltmeter,
a cork mat,
a ruler,
a lab coat.
In each of my experiments I will have variables and constants to ensure that my experiments are fair tests.
For each of my experiments I will calculate the resistance so I will have to take down the readings from the ammeter and the voltmeter. I must do this process as quickly as possible because once the wire has been heated, the resistance will vary.
I will alter the length of the wire using crocodile clips instead of cutting the wire. The lengths of my wire, which I will be using for my experiments, will be accurate to one millimetre.
I will repeat each experiment 3 times and calculate averages of the readings from the voltmeter and the ammeter.
The circuit I am going to use is:
A
V
Before each experiment I will ensure everything is connected in the correct order and the pointers on the ammeter and the voltmeter are at 0.
SAFETY
Before conducting my experiments I visually checked the circuit to ensure it would not be a short-circuit which could draw excessive current. I must also ensure that I have switched the power supply off at the mains.
PRELIMINARY EXPERIMENTS
I have decided to conduct some preliminary experiments so that I can be confident my results are accurate.
I decided that for my first experiment I will use a length of 5cm for my wire.
From these preliminary experiments I should be able to make predictions about the rest of my experiments. I will also discover any problems with my circuit or what is contained in my circuit if there are any
METHOD
First of all I plugged the power supply into a wall socket. I then set up my circuit as shown in my diagram. I connected a voltmeter across the nickel chrome wire.
After I had set my circuit up I switched it on quickly to ensure that it was correct and working. It was so I started my preliminary experiments. I decided I would do three sets of readings for each length so that I had an average calculation for each length.
RESULT
CONCLUSION
These experiments did not work, as all of my results are roughly the same. This is because the resistance was too low in the wire to see a noticeable change in the meter readings. As nickel chrome is a fairly thick wire I have decided to proceed with the rest of my experiments using a wire which has a higher resistance, so a smaller cross sectional area. The wire I chose was constantan wire.
HYPOTHESIS
I predict that when using a thinner wire I will obtain good results and that I will be able to show clearly the increase of resistance as I increase the length. This will be because the amount of atoms in the wire has increased and so there will be more atoms to collide with the electrons.
I think that when I plot a graph of unit length (cm) against resistance (ohms) it will show clearly that they are proportional to each other, as I think when the length of the wire is doubled, the resistance will be too. I think that the graph will look similar to:
From my graph I should be able to predict the value of resistance in relation to the length of the wire.
METHOD
For the following experiments I set up the circuit as in my preliminary experiments but I used constantan wire instead of nickel chrome wire.
RESULTS
CONCLUSION
My results enabled me to draw a graph which clearly shows the relationship between the length of the wire and the resistance. It has a very strong positive correlation and when a line of best fit is drawn it shows that they are directly proportional to each other. This means that when the length of wire is doubled, the resistance is also doubled.
Whilst conducting the experiments I noticed the wire turning black. This is because the wire had got heated and this had caused it to combine with the oxygen in the air.
The results I obtained supported the predictions I made in my hypothesis. I predicted that when the length of the wire was increased the resistance would also be increased. I predicted that the link between the length of the wire and the resistance would be directly proportional, my graph proves this to be true.
To prove that when the length of a wire is doubled the resistance is also doubled, I will use the line of best fit on my graph. The resistance of constantan wire with a length of 10 cm (according to my graph) would be 1.3 Ohms. The resistance of constantan wire with a length of 20 cm would be 2.55 Ohms, which is almost 2.6 Ohms. This proves my theory.
Also by looking at my graph I can state the resistance of constantan wire at the thickness I used to conduct my experiments in Ohms per metre. This is possible by looking at the resistance at 1cm (0.15 Ohms) and multiplying it by 100. The resistance of constantan wire at this thickness is 15 Ohms/m.
PERCENTAGE OF ERROR
Now I have calculated the resistance of the wire per cm or m I can do a mathematical treatment to find out what percentage of error there are on the lines which do not lay on the line of best fit.
My result for 17.5 cm is 2.04 Ohms but according to my line of best fit I should have obtained 2.25 Ohms. If I minus the result I obtained from the result I should have obtained and then divide this number by what I should have obtained and multiply it by 100 I will get the percentage of error.
2.25 – 2.04 = 0.21 (this is called the absolute error)
0.21/2.25 = 0.0933 (to 3 significant figures)
0.0933 x 100 = 9.3% (to 1 decimal place)
The next result on my graph, which does not quite fit my line of best fit, is my results for 20 cm. The result which I obtained was 2.38 Ohms but according to my graph I should have acquired 2.55 Ohms. By following the same procedure as previously shown I can find the percentage of error for this result:
2.55 – 2.38 = 0.17
0.17/2.55 = 0.0667 (to 3 significant figures)
0.0667 x 100 = 6.7% (to 1 decimal place)
The last result for which I will find the percentage of error is for a result which I obtained which is higher than according to my line of best fit. I obtained 5.23 Ohms for 40 cm, my line of best fit shows 5.1 Ohms.
5.1 - 5.23 = -0.13
-0.13/5.1 = -0.0255 (to 3 significant figures)
-0.0255 x 100 = -2.6% (to 1 decimal place)
These accuracy problems could be due to parallax error (I could have looked at the metres from different angles each time), temperature changes due to the wire getting heated or the variation in the contact made by the crocodile clips.
EVALUATION
I feel my overall results were accurate. This is shown in my graph where the points I have plotted are touching or very near the line of best fit. I did not have any anomalous results; the reliability of my results was increased because I conducted 3 experiments at each length.
I found it quite difficult measuring the wire accurately. This is because it was hard holding the wire straight while measuring it and then using the crocodile clips to secure the length. I was not sure that the crocodile clips were very secure, but by looking at my graph I now think the lengths I measured were accurate and the connections secure enough.
If I were to redo my experiments I would change the following factors: I would use pointers instead of crocodile clips, as they are more accurate because they have a smaller tip and they would not constrict the wire where they were attached to it. I would also prefer it if the wire were completely straight before I start my experiments.
BIBLIOGRAPHY
Oxford Interactive Encyclopedia CD – ROM
AirCom Education CD – ROM
Physics For All Book
Radio Communication Handbook Book by RSGB