- Potential Energy = mgh (mass x gravitation pull x height)
- Kinetic Energy = 1/2 mass x velocity (squared)
- Work Done = Energy Converted
We can combine the equations that will be most useful to me for the variable. These equations are
- Potential Energy = mgh
- Work = Force x Distance
We also know that work that is done is equal to the energy converted or gained. As the cylinder moves down the ramp, the energy conversion from potential to kinetic occurs. This theory gives us the equation:
↓ Work Done = Energy Converted
↓
Work = mgh
↓
Force x Distance = mgh
(Joules) (Joules)
This will enable us to find out what work is being done to the cylinder as it falls down the ramp.
(Both of the amounts in the equation above are both measured in joules because they are both measuring energy)
Variable 2 – The Distance up the Board
The prediction is similar to the first variable, the higher the cylinder starts up the ramp, the further it will go on the carpet. When the cylinder is higher it will make more potential energy as their will be more gravitational pull on it; again there will be a simple transfer from the potential energy already on the cylinder to kinetic energy when it starts to move.
- Potential Energy Lost = Kinetic Energy Gained
- Potential Energy = mgh (mass x gravitation pull x height)
- Kinetic Energy = 1/2 mass x velocity (squared)
- Work Done = Energy Converted
We can again combine the most useful equations above to come up with a combined equation.
- Potential Energy = mgh
- Work = Force x Distance
In this variable there will again be an energy conversion from potential to kinetic energy. We know that the potential energy that is lost is equal to the kinetic energy gained or in other words:
Mgh = 1/2 mass x velocity (squared)
We also know that the work done is the equivalent to the energy converted:
↓ Work Done = Energy Converted
↓
Work = mgh
↓
Force x Distance = mgh
(Joules) (Joules)
(Both of the amounts in the equation above are both measured in joules because they are both measuring energy)
Preliminary Work
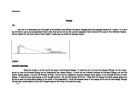
Before I started the experiment properly, I needed to find out what were the maximum and minimum quantities I could use for either the angle or the length up the board. This was due to the fact that I only had a set length of carpet, and if the angle was too high or the cylinder was too far up, the cylinder would roll off the end!
- There was a problem, in the way that for the bottom three angles, the cylinder didn’t gain enough momentum to make an acceptable distance on the carpet to measure it. The cylinder went the same distance for all bottom three angles from 30cm; the slight drop from the board to the carpet made it nearly stop dead. Therefore I placed a second layer of carpet on top of the original one for the bottom 3 angles, so that the end of the board lay exactly in line with the carpet. This gave it less drop-down and the results became more consistent.
In Variable 1 (changing angles), the maximum distance up the board for the cylinder was 28cm for the highest angle; the lowest angle had a maximum of 55cm. The maximum was determined by the fact that the cylinder rolled off the end of the carpet if it went any higher up the board. This led me to use the constant distance up the board for variable 1 to be 30cm; the further the cylinder went on the board, the most trustworthy the results would be.
For Variable 2 (changing distances up the board), the angle we used was notch 4, this was for the reason that it was neither too small, and neither too big; it gave results which were constant and easy to read as they were in the middle of the carpet. The smallest possible distance up the board that we could make an accurate measurement for was 5cm; any lower than this and it gave the intermittent results. The maximum distance was as high up the board the cylinder would go.
Results
The apparatus has given me the accuracy of 1 decimal place. If I used no decimal places, then the degree of accuracy would be less, and the averages would be less precise.
Graphs
Variable 1
The above graph has been written on excel for Variable 1, ‘Different Angles’. There is a distinctive line of best fit; the line does not go through the origin. This leads me to believe that, yes, the angle used for the board is directly proportional to the distance that the cylinder moves, as stated in my prediction. In other words this signifies that when one doubles, so does the other. On the other hand, when you look at the
dots on the graph, you can see that a slight curve appears towards the end of the line. This could mean that the angle may not always stay proportional to the distance the cylinder moves, as the angles get steeper. The graph follows on the next page….
As you can see, there is a distinct curve of which passes through the origin. This enables me now to create a brief conclusion for the first variable. When using small angles (i.e. 0-20 degrees), the distance the cylinder moves is proportional to the angle used. But, when the angle exceeds 20 degrees, the distance the cylinder moves gets smaller. This could be due to a number of suitable reasons.
Firstly, the potential energy might not increase with similar figures each centimetre the cylinder moves off the ground; this would mean less kinetic energy converted, finally leading to a smaller amount of work done and therefore less distance. Secondly, when the angle gets steeper, logically the cylinder will move down the ramp in a more vertical fashion. This could mean that the cylinder hits the carpet at a greater force, which would mean some distance taken away, due to the fact that there will be more friction, and not a smooth transfer from the ramp to the carpet.
Variable 2
The graph above for Variable 2, ‘Different Starting Positions’, there is again a distinct line of best fit, yet this time the line does not continue through the origin. In my hypothesis I predicted that the starting points of the cylinder would again be proportional to the distance it travelled. This would mean that when one doubles so does the other. There is a problem though; the line does not continue through the origin which indicates that it is not genuinely proportional. My largely prediction was correct; it is shown by the line of best fit above. Although, this gives us a logical conclusion that when the cylinder is let go at a higher position on the ramp, the further it will go. There is a slight problem in the way that there is a slight curve appearing towards the end of the line on the graph. As stated in Variable 1, it is possible that there is a limit to the starting positions of the cylinder, before it stops becoming proportional to the distance the cylinder travels. The curved graph is over the page….
The graph above is a perfect example of a curve. It is very noticeable and is able to show us that when the height up the ramp the cylinder starts, it does not always stay proportional to the distance it moves on the carpet. This again may be down to a number of reasons. Firstly, when the cylinder reaches a certain speed, it hits the carpet with such a force that the speed is slowed down, and consequently meaning less distance that it travels. Secondly, the potential energy might not increase with similar figures each centimetre the cylinder moves off the ground; this would mean less kinetic energy converted, finally leading to a smaller amount of work done and therefore less distance.
The predictions that I made in my hypothesis were nearly 100% correct, but only if you looked at the graphs in the simplest ways, i.e. accepting that there was a line of best fit and any dots outside of the line were anomalies. But, if you looked at the graphs carefully you could notice that there were curves, which will be investigated further on in the evaluating section.
Evaluation
The experiment went well on the whole, and the results I was able to obtain were mostly correct. The results also enabled me to prove my predictions that I made before I started the experiment. The evidence I obtained was fairly accurate; I used figures up to one decimal place to improve its dependability. The accuracy was great enough that I am able to assure myself that the conclusions are true.
There are two anomalies that I am able to spot, one on Variable 1, and one on Variable 2. The glitch on variable 1 was not too important, and didn’t go off the scale in a major way. It was from the angle of 8 degrees, and it was placed slightly off the line of best fit on the graph above. The glitch on Variable 1was also not too important. The anomalies may be due to the fact that the measurements may have been read wrong. Also the way that the cylinder’s stopping distance was measured was not too accurate, as there was a certain distance that the cylinder was away from the ruler, meaning that the results could easily have been read incorrectly.
The apparatus was principally satisfactory; the only improvements that could have been made were perhaps to have distance markings on the ramp to help the ease of use.
To investigate further for my experiment, I could have gone into detail on the curves that appeared on the graph, for example I could have extended the range of results available, by taking measurements with higher numbers, (i.e. for Variable 1, use 0-20 degrees, instead of 0-12 degrees). This would have been able to show me whether or not the curve continued in the direction it depicted on the graph.
Also I might have been able to use different apparatus to extend my investigation. I could have used different surface types for the carpet, different weights for the cylinder, or even reduced friction on the board by adding oil for example.
Finally to extend further, I could have tried to find a reason why the graph in Variable 2 did not extend though the origin.