The cross underneath the beaker will be used by the same pen. Therefore, the darkness of the ink cannot be any different. I shall mark out the cross once. This will be used for each experiment.
The ways in which the experiment will be safe shall be explained.
- I shall wear goggles. This prevents any chemicals entering the eye.
- I shall wear a whit lab coat. This prevents any chemicals getting onto my clothes. If the substance/chemical is corrosive, it could not only damage the clothes but also the person.
Prediction
I predict that as I increase the concentration, the quicker it will be for the cross to disappear. I predict this because when the molecules from the Hydrochloric Acid mix with the Sodium Thiosulphate they will collide with the molecules. There will also be more Hydrochloric Acid molecules, therefore overpowering the other molecules.
The diagram above shows how molecules collide more when the concentration is higher. This is known as the collision theory. This is when a solution is more concentrated, the particles collide more.
I also predict that the rate of reaction shall increase as the concentration is increased.
When an acid is added to Sodium Thiosulphate, a pale yellow sulphur precipitate is formed. The precipitate takes longer to form when the sodium Thiosulphate solution is diluted.
This is the equation for what should occur:
Na2S203+2HCI (aq) 2NaC1 (aq) +H20 (I) +S (3) +SO2 (g)
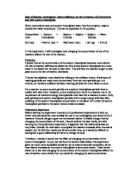
In the experiment, five different concentrations shall be used. They are:
- 0.2 Moles-25ml Hydrochloric Acid, 20ml Water, 5ml Sodium Thiosulphate
- 0.4 Moles-25ml Hydrochloric Acid, 15ml Water, 10ml Sodium Thiosulphate
- 0.6 Moles-25ml Hydrochloric Acid, 10ml Water, 15ml Sodium Thiosulphate
- 0.8 Moles-25ml Hydrochloric Acid, 5ml Water, 20ml Sodium Thiosulphate
- 1 Mole-25ml Hydrochloric Acid, 0ml Water, 25ml Sodium Thiosulphate
To pour the hydrochloric acid I shall use a burette. This enables me to pour the right amount each and every time. The picture below is a burette.
As you can see, it is a long thin tube with a tap just above the hole at the bottom. The tap enables you to pour the liquid quickly or slowly. Water will not be poured using a burette. Below is a picture of a beaker.
The experiment shall be carried out three times. There is a reason for carrying out the experiment three times; this is to enable us to gain results that are more reliable. With these results, I can then take the average and show this on my graph. This will also help me to draw a better conclusion.
As soon as I have my results, I shall work out the rate of reaction. I shall do this by using a formula:
Rate= 1
Time taken for the cross to disappear
For each result, the rate shall be calculated. This will help me to find out whether they match my prediction. I feel that as the concentration increases, the rate shall also increase.
I must also make sure that the temperature is consistent throughout the experiment. Temperature is a vital factor as it can affect the rate of reaction. I must make sure that each time I carry the experiment out the temperature is the same. It is known that when temperature rises the particles gain energy, this is kinetic energy. This makes the particles move faster. This raises the possibility of particle collisions.
Results
Rate of reaction
Analysis
Looking at the results that I have gathered from the experiment, I can see that as the concentration of Sodium Thiosulphate increased, the time for the cross to disappear also increased. The meaning of this is that when there is a higher concentration of something is added, in this case Sodium Thiosulphate, the quicker it was for the solution to react. My graph clearly shows that when the concentration had been increased, the less time it took for the cross to disappear.
The reaction graph allows us to see that the time and reaction have a negative correlation. The rate of reaction graph proves that when the concentration is increased, the rate also increases. This also proves that they are directly proportional to each other.
The graph showing the time for the cross to disappear line was curved. This illustrates to us the confirmation of the reaction when Sodium Thiosulphate is added to Hydrochloric acid.
Due to the varied concentration, there was an increase in the rate of reaction. A couple of things would occur if I had poured a more reactive substance:
- More reaction would occur.
- Reaction would not last as long however it would finish quicker.
When the concentration has been increased as well as the acids, the amount of ions that are moving within the solution shall increase. This will result in an increase of collisions. Conversely, not all chemical reactions happen because of collisions. The reason being is that some particles do not have adequate energy. It is known that the more energy a particle has, the bigger the chemical reaction will be. When the reactants increase the rate of reaction shall also increase. If there is a higher concentration of Sodium Thiosulphate than water, there is a bigger reaction with Hydrochloric acid.
I noticed that as the concentration increased, the less time I took the cross to disappear. Therefore, my prediction was right.
My prediction was proved right by my results. On my rate of reaction graph, I drew a line of best fit. This line does go through all the crosses. The reason for this is that not all concentrations have exactly double their rate of reaction. You usually find a slight difference, but not a lot. The results are not affected that much.
Evaluation
The results that I gathered were, in my eyes, very reliable. I did come across difficulties through the experiment.
There was a problem with deciding when the cross did actually disappear. If you focused hard, you were still able to see it, but if you did not focus hard, it would seem as if it had disappeared. My judgement of when the cross had disappeared was crucial, as I needed to obtain accurate results, or else it would not be fair test.
Thinking back to the experiment there were no human errors, by this I mean no wrong judgement by me or any other members of the group. We made sure that the temperature was accurate. We made two people look at the thermometer to make an accurate reading.
There may have been a few errors, which we may not have been able to do anything about it. For example, the measurements on the beaker may have been inaccurate, or the measurements on the thermometer may have been inaccurate. However, I could not help it if the readings were inaccurate. Looking at my results, it seems as if there was not an error.
Things could be changed to make my results different. The cross underneath the beaker could have been darker. This would have made the time for the cross to disappear longer. I would have kept the cross the same for each experiment as it would need to be a fair test.
The person who had the best vision could have carried out the experiment, as they would be able to judge when the cross disappeared more accurately.
There are always ways in which to improve an experiment. I could have taken readings for 0.1M, 0.3M, 0.5M, 0.7M and 0.9M as well as 0.2M, 0.4M, 0.6M 0.8M and 1M. This would have given me better results as well as a better graph. To make my results even better I could have gone past 1M and gone up to 3M.
To make sure the temperature was the same I could have used an electronic thermometer instead of a manual one. I could also have used a water bath. I could the have placed a white ceramic tile at the bottom with a cross on there to see when it disappeared.
Overall, the experiment went very well and this is reflected by my results made and by the rate of reaction graph and concentration graph.
Bibliography
http://www.chem.tamu.edu/class/fyp/ mathrev/mr-sigfg.html
http://core.ecu.edu/chem/chemlab/ equipment/eburette.htm