To gather the results, the calorimeter is filled with 100cm³ cold tap water, which is measured on the scales by placing the empty calorimeter on the scales, zeroing them, then adding the water until 100cm³ is reached. The calorimeter is then clamped in place. The fuel burner is weighed, and the number recorded for later. The wick is cut to 1.5cm in length, to give the most accurate results, as I am ensuring that each fuel burner will have a wick of the same length. (When the run has finished, the fuel burner is weighed first, before the wick is cut down, to ensure that no more fuel evaporates while the wick is being cut). The same scales are used in each run of the experiment; to make sure that no variations between different sets of scales reduces the accuracy of the results.
Once the fuel burner has been weighed, it is placed under the calorimeter, which has been clamped into place 8cm above the wick of the burner. The thermometer in the calorimeter is left in the water to allow it to give the temperature of the water, which is recorded to calculate the change in temperature. A splint is then lighted using the Bunsen burner, and the wick of the fuel burner is then lighted, with the lid of the burner lifted off just before you light the wick, to ensure that the mass of the burner changes as little as possible through evaporation of the fuel into the air. The burner is then left to heat up the water in the calorimeter, and the lid is placed on it as soon as the thermometer has increased by 15ºC. The fuel burner is then taken to the scales, and weighed again in the same manner as before. This number is recorded also, and the difference between the first and second recordings is calculated. This is repeated three times for each alcohol, and an average mass difference calculated at the end. This is so that a fair comparison can be made between the fuels after the experiment. The calorimeter is emptied of water and dried inside as much as possible. Then it is cleaned outside using a scouring pad and emery paper, to ensure that the calorimeter conducts heat just as well in each run of the experiment.
Diagram
Safety
To keep safety to a maximum during the investigation, many things were done. All bags, coats and stools were placed underneath the desks so that they could not get in the way of anybody during the experiment. Goggles were worn at all time; as we were dealing with alcohols, hot liquids and glassware. Lab coats were worn to reduce chances of damage to clothing. The Bunsen burner was used on a yellow safety flame, so that people could see it was there, and to stay away from it. When the fuel burner was being carried to and from the scales, extra care was taken to make sure that it was not dropped and broken. Stock bottles of alcohol were kept away from naked flames so they could not catch light.
Fair Test
There were a number of things we had to control to make sure our experiment was a fair test. To begin with, in our groups which we worked in to gather the data, we allocated each other specific jobs, so that we became ‘specialized’ and so even if there were mistakes in our technique, the mistakes were repeated throughout all the experiments and so the end result should be the same, reducing the chance of overall error and inaccuracy. We also used the same calorimeter each time we did our experiments. This was because a slight difference in the weight of each calorimeter was noticed, and therefore a different density; which would affect their ability to conduct heat, and so the same calorimeter would need to be used each time to make the experiment a fair test. We also noticed that different scales could give different results, and so we used the same set of scales each time. The water used was always taken from the tap, and so although it contained impurities, all the experiments were performed using this water, so the accuracy of the experiment was not at risk.
Variables
We had to keep some variables the same, as well as change one. The distance from the bottom of the calorimeter to the top of the wick was measured each time so that it was always 8cm; otherwise different amounts of energy could escape each time if the distance was not uniform, and jeopardizing the accuracy of the results. The length of the wick was also measured and kept the same so that the same amount of fuel could be burnt at a time. Another variable we controlled and kept the same was the mass of water used in the calorimeter. If this were changed then all the results would be wrong, because it would take different amounts of energy to heat different volumes of water. We also had to make sure the temperature change we used each time was the same. We did this using a thermometer to measure the 15ºc change. The variable we changed was the alcohol used in the fuel burner.
We used Methanol, Ethanol, Propan-1-ol, Butan-1-ol and Pentan-1-ol in the experiment. We used these five because they should give us clear results, and they range from short chained to long-chained hydrocarbons, so patterns should be easy to spot in the conclusion.
CLEAPPS hazards were used to identify risks and hazards that could apply to us, when using the alcohols. When using the alcohols as fuels, windows must be open to provide ventilation. If the alcohol is spilt on skin, the contaminated area must be washed thoroughly with cold water.
Results:
Methanol
Ethanol
Propan-1-ol
Butan-1-ol
Pentan-1-ol
Calculations
To calculate the H of an alcohol the energy transferred and the number of moles used has to be calculated.
Energy transferred to = Change in water temperature x 4.2J x Mass of water
water from burner
= 15 x 4.2 x 100 = 6300J
The value calculated for the energy transferred will be constant with each alcohol
Number of moles used = Difference in mass of fuel
Mr
1 mole of alcohol produces: Energy transferred to the water
Moles used
Methanol
Methanol’s Mr = 32.0g
Average difference in mass = 0.85g
Number of moles used = 0.85 = 0.0265625mol
32
1 mole produces: 6300 = 237176.4706mol
0.0265625
Corrected to kJ/mol = 237176.4706 = 237.18 kJ/mol
1000
Ethanol
Ethanol’s Mr = 46.0g
Average difference in mass = 0.49g
Number of moles used = 0.49 = 0.010652mol
46
1 mole produces: 6300 = 591428.5714mol
0.010652
Corrected to kJ/mol = 591428.5714 = 591.43 kJ/mol
1000
Propan-1-ol
Propan-1-ol’s Mr = 60.0g
Average difference in mass = 0.39g
Number of moles used = 0.39 = 0.0065mol
60
1 mole produces: 6300 = 969,230.7692J
0.0065
Corrected to kJ/mol = 969230.7692 = 969.23 kJ/mol
1000
Butan-1-ol
Butan-1-ol’s Mr = 74.0g
Average difference in mass = 0.35g
Number of moles used = 0.35 = 0.00472972973mol
74
1 mole produces: 6300 = 1,332,000J
0.00472972973
Corrected to kJ/mol = 1332000 = 1,332kJ/mol
1000
Pentan-1-ol
Butan-1-ol’s Mr = 88.0g
Average difference in mass = 0.32g
Number of moles used = 0.32 = 0.0036363636mol
88
1 mole produces: 6300 = 1,732,500J
0.0036363636
Corrected to kJ/mol = 1732500 = 1,732kJ/mol
1000
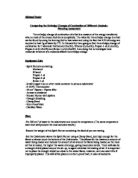
Energy produced from each alcohol (kJ/mol)
Analysis
My graph shows that there is a trend that as the number of carbon atoms in the molecule increases, the molecule releases more energy. With each additional CH group there is an increase of around 300 - 400 kJ/mol. This is because the reactions are exothermic. And so with the extra CH group there are more bonds broken and less formed. With less bonds being formed than broken then energy is given off, and if the ratio is increased further, then even more energy is given off.
Evaluation
There were a number of sources of error in my experiment. For example, much of the heat given from the fuel would have been lost because the calorimeter was placed 13cm away from the heat source, and although draft excluders were used some heat will have escaped. Also, because we were using alcohols, windows had to be opened for ventilation, which caused drafts which stopped all the energy being used to heat the water. It was left to human judgement, when the temperature had reached 15ºC above the starting point, and so there could be error in the judgement. Another problem would be the build up of soot on the bottom of the calorimeter. Although this was cleaned after every run, it still became insulation to the water, stopping it from heating slightly. Also, the calorimeter which was used was heated slightly, and so energy was wasted by the heating of the calorimeter. The errors could have been reduced if an electric thermometer were used, and so a more accurate reading could have been gathered. Also, if the experiment was performed under more controlled conditions, where no energy could escape from heating the water then the experiment would give much more accurate results.