An “X” was marked using a black marker pen on a plain white square piece of paper. It was placed underneath the conical flask that contained the measured sodium thiosulphate.
The stop clock was wound up fully, checked that it worked and the placed near the conical flask. The stop clock was started when the hydrochloric acid was poured from the measuring cylinder into the conical flask that contained the measured sodium thiosulphate. The conical flask was swirled gently only slightly above the table. It was observed approximately 20cm directly above the conical flask. When the “X” could no longer be seen the stop clock was stopped.
Safety
Throughout the experiment lab coat and safety goggles were worn because acid was involved.
The conical flask was observed from a safe distance because sulphur dioxide was produced. Sulphur dioxide has could cause an asthma attack.
Results
It took 30 seconds for the “X” to disappear.
I have decided to study the effect of changing the concentration of the reactants in this experiment.
Prediction
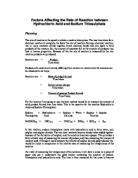
Box A Box B
Box B has a higher concentration of white particles than in box A. This means that it will take less time for a reaction to occur in box B than in box A because it is more likely that a black particle will collide with a white particle.
I predict that if I half the concentration the time the experiment takes will double. I have come to this conclusion because I think that having double the amount of white particles doubles the chances of a black particle hitting a white particle therefore halving the time it takes. Likewise, I think that in having only half the amount of white particles it will half the chances of a black particle hitting a white particles therefore doubling the amount of time the experiment takes.
E.g.: 40g/dm3 took 30 seconds therefore 20g/dm3 should take a minute.
Method
For this experiment I’m going to wear safety goggles and a lab coat as acid is involved.
Apparatus:
- Hydrochloric acid
- Sodium thiosulphate
- Water
-
Seven 25cm3 measuring cylinders -to make the different concentrations of sodium thiosulphate in
-
10cm3 measuring cylinder -to measure the Hydrochloric acid in
- Beaker
- Stop watch -to time the experiment
- Piece of plain white paper -to mark an “X” on
- Black marker pen -to mark an “X” with
- Note paper and pencil -to note down times
- Calculator -to calculate the concentrations
For my concentration range I will not go over 40g/dm3 because it’s unavailable. I will use 5, 10, 15, 20, 25 30, 35 as my range of concentrations.
To make my concentration I will use the following equation:
volume wanted x concentration wanted
concentration you have
The answer to this equation gives me the amount of sodium thiosulphate that is needed. The rest of the 25cm3 measuring cylinder will be filled with water. This will give me the correct concentration.
To make my experiment fair I will use the same volume for the sodium thiosulphate throughout everything.
Firstly, I will make the concentrations.
I will measure out 25cm3 of 5g/dm3 sodium thiosulphate using a 25cm3 measuring cylinder and pour it into a beaker. I will then measure out 10cm3 of hydrochloric acid with a concentration of 2M. I will draw a “X” on a plain white piece of paper, using a black marker pen, and place it underneath the beaker. I will have my stop watch (checked and working) close by, so that when I add the hydrochloric acid to the beaker I can start timing. Once the hydrochloric acid is added into the beaker containing the sodium thiosulphate and the stop watch is started I will observe the “X” approximately 20 cm directly above the beaker, when I can no longer see the “X” I will stop timing and mark down my results.
Analysing my Results
Results table
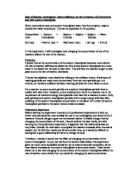
My first graph (labelled 1) is plotted using the initial results in seconds.
My second graph (labelled 2) is plotted using 1 x 10⁴. This graph shows the rate of
T
reaction.
These results are fairly good although I think that they can be improved. The results should all be aligned in graph 2, but I can’t expect it to be perfect because I rounded the numbers when making the concentrations, so I was not exceedingly accurate.
I don’t think I have any anomalous results. My results are not too far off the lines of best fit.
In my prediction I stated that if I doubled the concentration so I halved the amount of time the experiment took. I will test this with my results.
If 40g/dm3 took 30 seconds then 20 g/dm3 should take 1minute.
In my results 20g/dm3 took 1minute 3seconds.
If 20g/dm3 took 1minute 3seconds then 10g/dm3 should take 2minutes 6seconds.
In my results 10g/dm3 took 2minutes 51seconds.
If 10g/dm3 took 2minutes 51seconds then 5g/dm3 should take 5minutes 42seconds.
In my results 5g/dm3 took 6minutes 23seconds.
In using my rate of reaction graph (i.e. Graph 2) I will pick out some results.
5g/dm3 is 40S-1, which means that 10g/dm3 should be 80S-1 and it is.
If 10g/dm3 is 80S-1, then 20g/dm3 should be 160S-1 and it is.
This shows that my line of best fit is correct and that my results are not far off, which means that nothing went awfully wrong in my experiment, but the results are not exactly at the expected time because of experimental error.
Evaluation
I think that this experiment was good because it gave me sufficient results to prove that halving the concentration doubles the time and doubling the concentration halves the time.
I think that my results are reliable as they are not too far off the line of best fit. This line of best fit also happens to show the results that I should have, which means my results were good and fairly accurate.
I also think that my results are good enough to make and support a firm conclusion that as concentration doubles so the time halves.
I didn’t have any anomalous results, which is good because this means that my experiment went well and I did everything correctly.
My method was good because I had a good range of concentrations. This meant that my experiments didn’t take too long and therefore I had time to repeat some of them.
I also gained some good results from the range of concentrations. If my concentrations were too close or too widely ranged then my results would not be quite so accurate as they are. Having too many points on my graph would make it confusing and not having enough points on my graph would make it hard to draw a good line of best fit.
To improve this experiment I would laminate my “X” because when I was doing the experiment my cross faded because it got wet. I had to keep drawing new ones, but if I had a laminated “X” I could then keep it constant. Having a faded cross would affect my results because it means that it won’t be so clear through the cloudiness that occurs in this reaction therefore it would take less time to disappear.
To improve it further I could keep the temperature constant in every experiment. As my results were recorded on two different days the temperature of the room on those two particular days could have been very different. Even a slight difference could affect my results. A 10 degree difference doubles the rate of reaction.
I could heat or cool my solutions so that they are the same every time I do the experiment.
If I had more time I would repeat ALL of my experiments as I only had enough time to repeat 4. This would support my initial results more.
For further work that could provide additional relevant evidence I could investigate another factor that affects the rate of reaction between hydrochloric acid and sodium thiosulphate.
In this experiment I would change the temperature of both the solutions. I would do this by measuring 25cm3 of sodium thiosulphate using a 25cm3 measuring cylinder and then pouring it into a test tube. I would the measure 10cm3 of hydrochloric acid using a 10cm3 measuring cylinder and then pour it in to a test tube. I would then put both the test tubes in either a water bath or a beaker filled with water on a tripod with a Bunsen burner underneath. It would probably be better to use a beaker filled with water on a tripod with a Bunsen burner underneath, that way you can control the temperature of the water in the beaker and the temperature of the solutions. I would have a thermometer in the beaker as well as both the test tubes. I would choose a range of temperatures to heat the solutions to, such as, maybe, 25oC, 30oC, 35oC, 40oC, 45oC and 50oC. This would give me a good range of results.
After heating the solutions I would draw a dot with permanent marker pen on a test tube, put it in the beaker with the heated water and pour both solutions into it. I would time how long the experiment took. I would make sure the dot would be on the side of the text tube furthest away from me so that I would be looking through the solution. I would watch the dot at eye level and wait until I can no longer see it and then stop timing. I would record my result and repeat the experiment for each temperature.
For this experiment the apparatus needed would be:
- hydrochloric acid
- sodium thiosulphate
- three test tubes
-
one 25cm3 measuring cylinder
-
one 10cm3 measuring cylinder
- one black permanent marker pen
- one beaker
- one tripod
- one Bunsen burner
- note paper and pen
- stopwatch
I think that my results for this experiment would show that for every 10 degree rise in temperature, reaction rate doubles.
I could only investigate this if I had time.