To even out, the potato must let water out through its selectively permeable membrane, and
therefore reducing the water content of the potato. This will work vice versa, when the potato is
placed in a dilute solution, to even out, it will let water in. I think that at one point, that there
might been little, to no osmosis taking place, this is because both solution will be at the same
concentration, so the water molecules will not try and even out.
Method
To do the experiment, I will need 6 ‘chips’ carved out of a potato, 6 solutions with different
concentrations of solute, test tubes, a measuring cylinder, a ruler, a tile and a sensitive weighing
machine. I will set the apparatus as shown below:
Firstly I will measure the mass of the potato segment on the weighing machine. I will then
record its initial mass down in my table. Then I will place the potato into 6 various concentrated
solution, 0.25M, 0.50M, 0.75M, 1.00M, 1.25M and 1.50M. The solution will be in a test-
tube. I will then leave the potato in the solution for 10 minutes timing with a stopwatch. Once the
10 minutes is up, I will take the potato and measure its mass, and record the reading. I can then
find the mass difference, and by this I can see how much water was gained and was lost.
To make this a fair test I will make sure that there is the same amount of solution in the test-
tube every time. To do this I will measure the volume of the water in a measuring cylinder
(30ml). I will also try to keep the temperature roughly the same, though it will be difficult to
keep exactly the same, as the temperature in the room will keep changing, therefore changing
the temperature of the water. There are other things I could do to make a fair test, but may be
too difficult for me to achieve in this experiment. How fresh the potato is may affect osmosis,
and where the potato is placed in the test-tube may have an effect, as if a large part of the
surface is placed on the side of the inner test-tube, then that side may be slightly blocked from
the water, causing a reduction in osmosis taking place.
To get more accurate results, I should take an average reading for each solution, that way if
something went wrong in a certain part of my result taking, it shouldn’t affect my graph and
outcome of the experiment. I will take 6 readings as I feel that it gives a significant about of
points, to plot a good line graph.
I will do a preliminary experiment to see if the experiment works well, without too many
problems. If there are then I will be able to change, before doing the actual experiment.
The formula I will use to find the percentage gain/ loss will be;
Final Mass – Original Mass x 100
Original Mass
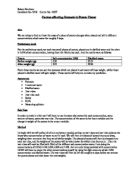
Preliminary Experiment
For my actual experiment to go smoothly and for me to get the right sort of results to analyze, I
needed to do a preliminary experiment to find out how certain things will work during my
experiment. For example, I could have tested what size potato ‘chip’ was most suitable for
getting results, how much water I should put into the test-tube and how long I should leave the
sample in the solution. In the end I decided to test what length of time gave the most efficient
results, and gave me enough time to do the experiment, and to pack away the apparatus.
For my preliminary experiment, I got 4 potato chips that were roughly 8 x 0.5x 0.5cm in size
and took their individual mass on the weighing machine and recorded their mass down. I then
placed all the samples into separate test tubes. In each of the test tubes was 30ml of distilled
water. Once I placed the potato chips into the test tube, I started the stopwatch. What I then
did was leave one the potato chips in the test tube for 5 minutes, one for 10 minutes, one for 15
minutes and one for 20 minutes. I would take each out at the appropriate time and measure
there mass. I then found the mass change and work out the percentage rise by using the formula
mentioned in the method. It is almost certain that the mass will increase, as the potato is in a
zero concentrated solution, so water will move into the chip. The results of the experiment
were…
Time/
min
Original
Mass/ g
Mass after
experiment/ g
Mass gain/
loss/ g
Percentage gain/
loss %
5
4.16
4.38
0.22
5.3
10
3.75
4.41
0.66
17.6
15
3.68
4.39
0.71
19.3
20
4.2
4.8
0.6
14.3
From my results I can see that the most efficient was the chip that was in the test tube for 15
minutes. However I think that it should have been the one that was in 20 minutes that had the
highest percentage rise, as there was more time for osmosis to take place. This could have been
down to measurement mistake on my behalf. I have decided to use 10 minutes as my time in my
experiment. This is because it gave a significant result, and gives me enough time to do the
experiment properly. I have also decided to stick to the potato chip being 8 x 0.5 x 0.5cm, and
the volume of water in the test tube as 30ml, as both gave good results.
Results
Concentration of
solute/ M
Initial
mass/ g
Mass after 10
minutes/ g
Mass gain/
loss g
Percentage
gain %
Average
Percentage
gain %
0
3.75
4.41
0.66
17.6
11.8
0
5.36
5.68
0.32
6
0.25
3.59
3.62
0.03
0.8
0.5
0.25
4.32
4.33
0.01
0.2
0.5
3.7
3.55
-0.15
-4.1
-4.5
0.5
4.62
4.4
-0.22
-4.8
0.75
4.09
3.85
-0.24
-5.9
-5.3
0.75
4.34
4.17
-0.17
-4.6
1
3.93
3.59
-0.34
-8.7
-10.0
1
4.51
4
-0.51
-11.3
1.25
4.17
3.78
-0.39
-9.4
-7.9
1.25
5.28
4.95
-0.33
-6.3
1.5
4.14
3.73
-0.41
-9.9
-9.2
1.5
5.18
4.74
-0.44
-8.4
To make my experiment more time efficient and so that I could get more results to form an
average, I decided to stagger my starts after every minute. This turns from getting a set of results
in around 45 minutes, into only approximately 15 minutes, leaving me more time to do the
experiment more accurately.
Analysis
From my graph what I can see initially is that, as the concentration of the solute in the test
tube increases, the percentage loss of the potato chip increases. The line in my graph is a curve.
At first it starts as a straight line, with a large gradient. Though, as the line reaches zero on the
‘x’ axis, it starts to curve off and the gradient gets continually smaller. I can see that when the
solution in the test tube was hypo tonic to the potato that the decrease of mass was much more,
then when the potato chip was in a hyper tonic solution. Also from my graph, I can tell
approximately when both the potato and the solution had the same concentrations, when the
solution was isotonic. This is shown on my graph as around 0.3M. After calculating the inverse
of my results, I found that percentage loss and concentration were not inversely proportional to
each other, as a straight line through the origin did not occur.
I think that my graph turned out like it did, because of my prediction I stated in my planning.
As the concentration of the solute increased, the percentage loss increased, this was because
the water molecules were leaving the cell to even out the concentration gradient. The higher the
concentration, the more water left the cell, the higher the mass lost from the potato. This was the
case for when the solution’s concentration was weak, as there was a large increase of mass
(11.8%) when it was placed in zero concentration (distilled water), because water molecules
were entering the cell to even out the concentration gradient.
Why I think the gradient of the graph started to decrease and that the percentage mass lost
between the steps was becoming less and less, is because as the concentration increases, more
water leaves the cell. When the water leaves the cell, the plant cell starts to lose its firm, turgid
shape, (see FIG3). As this happens, the vacuole is shrinking and tearing away from the cell wall,
which it’s already starting to lose its shape. When this happens, spaces start to appear in the
cell. What fills these spaces is the salt from the solute coming into the cell. This then adds onto
the mass of the potato, but not enough to make the mass of the potato increase. So when the
concentration rises, more water is lost, causing more space in the cell to be filled up by the
solute, making the percentage mass lost, not as much as the weaker solution.
Evaluation
Doing the experiment and collecting the results was fairly simple. My initial method did not
need to be altered, and there were no real difficulties I came across. There were slight
problems; such as trying to remove the potato chip out of the test tube was the allocated time
was up, sometimes the chip would slip out of the tweezers. To try and combat this I decided to
use my finger, and scoop the chip out along the side.
I think the amount of results I took were adequate, as my graph showed a distinct curve. Also
the fact that my graph started on zero concentration meant that I could not have gone further
along the ‘x’ axis.
Looking at my graph, most of the points were roughly situated around the line, except the
result for the solution with 1.0M concentration, which was such a strange result compared to the
others, that I will ignore it. There are many reasons why some of the results might not be
accurate; when I took each chip out of the solution and then measured them, many of the chips
were still wet, and had drips of the solution on the surface. These drips from the solution would
have caused the chips mass to be higher then it actually was. Another reason could have been
that; the overall temperature of the laboratory was quite high and there was heat from the
sunlight that was coming through the windows. As I was taking the chip to be weighed this
could have caused some of the water in the potato cells to evaporate. With some of the water
evaporated from the chip, the mass of the chip would have decreased from what its mass was
when it just left the tube, causing inaccuracy within my results. It could also be that the chip’s
mass decreased because, when I was trying to remove each chip from the test tube, I had to
either squeeze hard with the tweezers, or push the chip hard against the side of the test tube to
scoop it up. This pressure exerted on the chip could have either caused small bits of it to break
off. It could have also caused some of the water to be squeezed out of the cells of the chip,
though probably didn’t have a drastic effect on the mass. The one anomalous result that I
collected could have been because of water being evaporated from it and because of the force I
used to get it out of the test tube.
How I would make my experiment better, would be that when I took the chip out I would use
my finger and wipe the surface, making sure that there wasn’t too much solution on the outside
affecting the mass. To make sure that there was as little evaporation as possible, I would do my
experiment nearer to weighing machine and I would have a fan working next to my experiment,
this would make the air around the chips as cool as possible. Also, the way I would remove my
chip from the test tube would be that I would pour the content of the test tube into a sink, but
catching the chip in my hand. This way I wouldn’t put so much force on it.
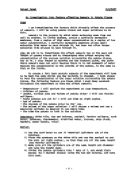
To extend my investigation, I could do the same experiment, but using different vegetables.
Such as carrots, lettuce, leek etc. I would collect results in the same way I did for the potato.
Also in the same way as I found the concentration of the solute in a potato cell (when it was
isotonic), I would find out the concentration of other vegetables cells. Once I find out the
concentrations, I could see if there is any connection on why they have certain concentrations. It
could be for climate and environmental reasons that they need different strengths of solution. To
see if this is true, I could do the experiment on vegetables that grow in a cold climate, and then
test vegetables that grow in warm climate and see what (if any) differences there are.
Conducting Paper
Investigation
Physics G.C.S.E
Coursework
William Davies
10 Keats