Results
As shown below there is only a range of five readings, which start to show a pattern, that the best fit line is directly proportional. To see if this trend carries on, I will widen my main experiment and use a 100cm length of wire, I will also take the readings every 5cm and not 10cm. From my experimentation with the power supply, I have decided to keep it at 4V, as I do not need the wire length to go lower than 10cm.
Length (cm) Current (Amps, A ) Voltage (Volts, ) Resistance (Ohms, ) Average resistance (Ohms, )
50 0.250.220.350.290.43 0.340.300.520.330.44 1.411.361.491.131.02 1.54
40 0.270.180.140.110.09 0.340.230.180.140.12 1.261.271.281.271.32 1.28
30 0.270.190.150.120.10 0.260.180.140.110.10 0.960.950.930.911.00 0.97 wwfc fcw esfcfcs ayfc fcba nfc kcfc fcuk.
20 0.350.160.120.090.07 0.230.110.080.060.05 0.660.690.660.660.71 0.68
10 0.270.190.130.100.07 0.100.060.050.030.02 0.370.320.380.310.29 0.33
Main Experiment
Prediction
I predict that if the length increases then the resistance will also increase in proportional to the length. I think this because the longer the wire the more atoms and so the more likely the electrons are going to collide with the atoms. Therefore, if the length is doubled the resistance should also double. This is because if the length is doubled the number of atoms will also double resulting in twice the number of collisions slowing the electrons down and increasing the resistance. My graph should show that the Length is directly proportional to the resistance. vOKy46mdi Visit essaybank ee co ee uk ee for more ee Do not ee redistribute vOKy46mdi
If the length of the wire is only half the length of the wire on the same type of wire, there should be half the number of collisions between the electrons and the atoms.
If the wire is twice as long, there should be twice the number of atoms, resulting in twice as many collisions and a predicted doubling of the resistance.
Safety
Handle the power supply carefully.
I am going to only use a voltage of four volts so the wire will not burn.
Be careful when touching the wire, as it may be hot.
Start on the lowest current, so the wire then will not melt or burn instantly.
Be careful when the wire is connected, as it will get hot.
Be careful when cutting the wire.
Make sure the mains to the power supply is switched off when removing the wire from the circuit to be measured. wwab abw esababs ayab abba nab kcab abuk;
Apparatus
Power Supply,
Ammeter,
Voltmeter,
Just over 100cm of E26 Wire,
Meter Rule,
Two Crocodile Clips,
Connecting Wires.
Factors which must stay constant to keep the experiment a fair test
The power supply must stay on 4V,
The wire must be the same thickness,
The surrounding temperature must be constant,
The equipment should be kept the same,
The edge of the crocodile clips should be at the edges measured length.
The Variable factor
The factor that I am going to vary is the length of the E26 wire.
Circuit diagram
Method
The circuit was set up as shown above. A table was drawn out and the results were recorded. To improve the accuracy, compared to my preliminary results for my main wwfe few esfefes ayfe feba nfe kcfe feuk.
Experiment, I have decided to set up the circuit with the metre rule selotaped to the bench. This will make it easier and more precise as I will not have to keep on holding the wire then putting the crocodile clips on. I have chosen to use a meter ruler because the lengths that I will be measuring are to big for a smaller ruler and the meter ruler can be accurate to +1mm. Make sure that the metre rule is actually one metre long and not one or two centimetres shorter. Next, move the crocodile clips down five centimetres rather than ten (as done in preliminary) each time to record the results. Use the E26 wire as it will also be easier to measure any change in resistance. To collect the data for my graph I have chosen to take a range 20 of lengths. I have chosen a range of 20 as to plot an accurate graph, I will need at 20 points to mark on the graph if I want to make precise and reliable results, to see if there are any patterns and trends. I have also chosen to take five repeats at each length and then take an average, to get reliable results. The lengths that I have chosen are as follows: 100cm, 95cm, 90cm, 85cm and going down in fives to 10cm length of wire. I have chosen these lengths because they are easily measured by the meter ruler and give a good range of results.
As my preliminary results start to show a pattern in the readings (Resistance is directly proportional to length) to expand on my experiment and to see if this pattern continues, I am going to try the above lengths.
This coursework from ()
Reproduction or retransmission in whole or in part expressly prohibited
Results
To calculate the resistance of the wire, I shall use the equation below.
RESISTANCE = VOLTS/AMPS
Below is a results table with the results that I collected from my main experiment.
1 2 3 4 5
Length (cm) Volts (V) Amps (A) Resistance (Ohms)R=V/I Average Resistance (Ohms)
100 0.330.200.220.180.17 0.100.060.070.060.05 3.333.333.143.003.40 3.24
95 0.710.520.350.320.23 0.230.180.110.100.07 3.092.893.183.203.28 3.12
90 0.700.460.340.270.22 0.260.150.110.100.07 2.793.063.092.703.14 2.94
85 0.650.420.330.270. 26 0.270.140.130.110.08 2.403.002.542.453.25 2.78
80 0.700.540.390.280. 21 0.290.230.160.120.09 2.413.352.432.332.33 2.56 wwbb bbw esbbbbs aybb bbba nbb kcbb bbuk:
75 0.550.340.260.210.19 0.250.160.120.090.08 2.222.132.172.223.37 2.42
70 0.510.330.230.180. 17 0.240.160.100.080.06 2.132.122.132.242.80 2.25
65 0.440.270.210.200. 18 0.220.140.100.110.09 2.001.942.101.812.00 2.11
60 0.220.130.230.200.07 0.110.200.120.090.10 2.001.531.922.011.28 1.75
55 0.330.280.250.240.19 0.200.170.140.120.11 1.651.651.792.001.72 1.76
Length (cm) Volts (V) Amps (A) Resistance (Ohms, ) Average Resistance (Ohms, )
50 0.290.150.240.120.11 0.190.090.130.080.07 1.531.671.841.501.57 1.61
45 0.610.370.280.180.17 0.360.200.180.150.14 1.691.851.561.201.23 1.43
40 0.440.270.180.140.110.19 0.330.340.230.180.140.15 1.241.261.271.281.271.27 1.26
35 0.370.210.160.110.19 0.340.200.150.100.08 1.091.051.061.102.36 1.13
30 0.260.180.150.120.10 0.270.190.150.120.10 0.960.941.001.001.00 1.00 wwfd fdw esfdfds ayfd fdba nfd kcfd fduk.
25 0.250.140.110.090.07 0.310.170.140.110.08 0.800.820.780.810.87 0.85
20 0.230.110.050.160.05 0.350.160.120.120.07 0.650.680.141.300.72 0.65
15 0.170.100.070.050.04 0.330.190.130.100.08 0.510.530.530.500.50 0.52
10 0.100.060.060.030.02 0.270.190.130.100.07 0.370.320.460.300.29 0.34
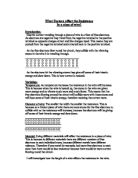
I have also drawn a graph to show how the average resistance changes with length
Analysis
In my prediction, I stated that:
If the length increases than the resistance will also increase in direct proportion to the length.
From my graph on the previous page, I can see that the resistance of the wire is directly proportional to the length of the wire. I know this because the Line of Best Fit is a straight line through the origin showing that if the length of the wire is increased then the resistance of the wire will also increase in proportion to each other. The line of best fit is a straight and it goes though (0,0) if there is no length, there is no resistance proving that the resistance of the wire is directly proportional to the length of the wire. This proves my prediction right. I can work out the gradient of this line by dividing the Resistance by the length. So, 1.75/55=0.0318
The length of the wire affects the resistance of the wire because the number of atoms in the wire increases or decreases as the length of the wire increases or decreases in proportion.
The resistance of a wire depends on the number of collisions the electrons have with the atoms of the material, so if there is a larger number of atoms there winl be a larger number of collisions that will increase the resistance of the wire. If a length of a wire contains a certain number of atoms when that length is increased, the number of atoms will also increase. from www.essaybank.co.uk
If the wire is half the length of a certain wire, it would have has half the number of atoms, this means that the electrons will collide with the atoms half the amount of times. In addition, if the length of the wire was trebled or quadrupled, then the resistance would also treble or quadruple. This is indicated on my graph, with the length being 100cm and the resistance being 3.25 Ohms. This in theory would mean that at 50cm there would be a resistance of 1.63 Ohms. From the graph it is easy to tell that the theory is correct and therefore my results reliable. From my results table and graph, I can see that my results that I collected are quite reliable and accurate. I know this because my results table shows a few, individual anomalous results; the anomalous results are at lengths 95cm and 100cm. All the other points are extremely close to the line indicating that my results are accurate. wwce cew esceces ayce ceba nce kcce ceuk.
I think that my results are suitable to confirm my prediction and support a conclusion. I know this because outside resources (Textbooks and Britannica) say that ‘the length increases in direct proportion to the resistance.´
Evaluation
In the Analysis and the graph I have shown two main anomalous points, this means that there must have been a slight error in my experiment. As the wire, length is bigger at these points I found it harder to stretch it out and consequently, measure it accurately. Although the graph is overall accurate and the results precise it is easy to see, the anomalous averages plotted because they do not all lie along the same best-fit line. The graph shows that my results are reliable as there are only two main anomalous points, (which are easily accounted for) to improve the reliability of my results, I could do more repeats in doing this my average would be more reliable. wwcd cdw escdcds aycd cdba ncd kccd cduk; wwbd bdw esbdbds aybd bdba nbd kcbd bduk:
As I increased the wire length, the wire became hotter and gave off heat. This could explain why the anomalous results are at the top of my graph, 100cm and 95cm. I think one of the reasons why my experiment is quite accurate is because I tried to measure the wire as accurately as possible. The metre rule was selotaped onto the workbench. The wire was stretched until it was nearly in a straight line so a bit was overlapping at each end. As the metre rule was curved and worn down at the corners it was slightly hard to see where 0cm was. Finally, the inside edge of the crocodile clips were placed at the appropriate point. I still however would like to make the measuring more accurate
During my experiment, I have noticed several modifications I could make to improve on the Investigation if I was to repeat it.
The first of these modifications would be the circuit that I would use. To be more accurate with my results I would place the Metre rule directly under the wire, so therefore it would be measured easier and therefore making the lengths more precise.
Instead of connecting the voltmeter to the main circuit, I would connect it to the wire that is being tested. I would do this so that the voltmeter is measuring the voltage of just the wire being tested and not the wires of the main circuit as well.
To also improve on my results I could use a new or higher quality digital voltmeter. The next modification I would make would be to use pointers instead of crocodile clips to attach to the wire; I would do this because pointers would be more accurate. The pointers would be more accurate because the tips have a much smaller area than the crocodile clips giving a more accurate measurement of the length of wire. I would also use a newer metre rule. The graph shows that my results are reliable as there are only two anomalous points, to improve the reliability of my results, I could also have repeated the same lengths of wire more times. Although the wire is an E26 wire, the thickness of it may vary by a small amount and maybe helping to cause the anomalous results. Sometimes the ammeters flicked between a decimal point, I maybe could have thought it was the wrong number and therefore would have ended up with the wrong average resistance. In the experiment, I did not control the room temperature but instead just assumed it was keep constant throughout my experiment; this could have made the wire get hotter and therefore making my experiment not as accurate. In future experiments I would control this variable factor and make it a constant factor. I would do this, as it would be an unfair test if there were two known variables. 5qu from 5qu essay 5qu bank 5qu co 5qu uk wwee eew eseeees ayee eeba nee kcee eeuk.
As well as making these modifications, I could also expand on my investigation by testing the same wire but different widths of that wire. I would do this if I had more time to complete it. I think the circuit and method used was quite suitable although I would make the modifications above to improve my results. If I did this experiment again I would defiantly use top quality equipment, I would probably control the temperature and use pointers instead of crocodile clips. After changing those few things, there is not really much difference to how I would do the experiment again.