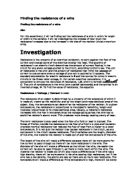
If this experiment was to be done under perfect conditions, this is what the graph should look like if the graph was plotted with the resistance against the length of the wire.
From the above table, it is shown that if you double the length of the wire, the resistance also doubles. This also happens with the voltage. If you double the voltage, the resistance also doubles. It also shows that the voltage is the same as the resistance if the current is kept the same and if the length of the wire is proportional to the resistance and the voltage. This pattern will only exist if the temperature of the resistor is kept the same.
As you can see from the graph, the line straightens out, as there is more resistance. This is because the resistor has been under heat and the atoms inside the resistor have been moving about due to kinetic energy. The current has found it hard to pass through the wire so there is more resistance.
Prediction
My prediction is that the nickel-chromium wire will produce more resistance if the nickel-chromium wire length is increased. I predict this because it is a fact that the resistance will increase if the resistor in size increases. This is because there will be more atoms for the current to flow through. This will mean that there is more resistance. The other factors that can affect the resistance is the temperature of the wire. I can also predict that the finished line graph will have a straightened out ending as the temperature will increase a lot and the amount of resistance will also increase.
Apparatus
The apparatus used for this experiment was: -
· 100cm piece of nickel-chromium wire
· Power Supply
· Voltmeter
· Ammeter
· Wires
· Crocodile clips
· 1m ruler
Method
First, the power supply was set up with wires leading out of it. The power supply was set as 2v and was at a direct current supply. The wire was connected to an ammeter and then to a resistor by crocodile clips. The voltmeter was placed parallel to the resistor as this allows us to see the potential difference across the nickel-chromium wire. Then, the wires were joined up and run back into the power supply. This is what the circuit looked like.
On the experiment on the length of the wire, I started at 60cm and then turned on the power supply. When I got readings from the voltmeter and the ammeter, I turned the power supply off and then resized the length of the nickel-chromium wire using the 1m ruler by placing the crocodile clips further down to a 40cm length. Then, the power supply was turned on again and took down the readings from the voltmeter and the ammeter. Once again, I turned off the power supply and resized the length by placing the crocodile clips to an 20cm length. I did this method by taking off half the previous length every time until the length of the nickel-chromium wire was down to 5cm long and as I went along, I obtained down the results. I repeated this method 3 times to give us an average, so I could get more accurate results.
On the experiment on the width of the wire, I started with five strands of wire each at 5cm long. I will connect all 5 strands to the circuit, turn on the power supply. When I got the readings from the voltmeter and the ammeter, I turned the power supply off and then remove 1 of the strands of wire, turn on the power supply collect the readings from the voltmeter and the ammeter, I turn the power supply of again and repeat the process of taking a strand of at a time, collecting the readings from the voltmeter and the ammeter until I have got down to the final strand.
The variables in this experiment were the length of the wire and the thickness of the wire.
I made this experiment a fair test by keeping the voltage going through the circuit the same every time. Also, the same wire was used every time so that the diameter and the material of the resistor were the same. This would have kept the experiment a fair test as there was no advantage or disadvantage for each experiment that was taken.
Results
Results for length of wire
Analysis
With scientific knowledge, the graph has turned out like it should have and that my results are accurate. As the length of the nickel-chromium wire increases, the voltage increases but the current decreases. Using the equation;
Resistance = Voltage / Current I have worked out the resistance, according to Ohm’s Law.
From my graph, I have found the pattern that the higher the voltage, the higher the resistance becomes. The graph shows that as the length of the wire increases, so does the resistance of the wire. An example of this is when the experiment at 40 cm was taken place and the resistance was 6.25 Ω. When 20 cm more was added on, the amount of resistance at 50 cm was 9.55 Ω. The reason for this occurring is because the current has had to pass through more atoms in the wire so there is more resistance for the current.
I could not find any patterns within the results but the graph still looks correct. Also with the graph, the line steadily increases and at the end, the line straightens out. This was expected because there was plenty of heat generated and the atoms will be moving about a lot. The current will find it hard to pass through all the atoms so there is plenty of resistance. Also, the obvious outcome of the results is that the longer the wire, the more resistance there is, due to more atoms for the current to pass through. My results support my prediction and research because I did identify that the graph will have a slanted end and that it was because of the increase of heat. Also, I identified that the longer the wire, the more resistance. With the 3 repeated experiments, the difference between each one is very small. The reason why if the voltage increases, the current decreases is because the length of the wire will either decrease or increase the current. As current is the amount of push going around the circuit, the amount of push will be decreased if the length of the wire is increased. Everything that has happened with this experiment was as I had expected.
My graphs are accurate and I shall have evidence by doing another experiment. I will set up a circuit, which will look like the circuit before, but the resistor (nickel-chromium wire) will be of an unknown length. I will take the readings from the voltmeter and the ammeter when the current is at a DC supply and a power of 2V. Then 5cm was decreased from the unknown length of the resister and the power supply was turned on again. Once again, the readings from the voltmeter and the ammeter were recorded. I repeated this 5 times and then the whole thing was re-done 3 times to make the experiment more accurate. The results were then made into an average so that there was an average voltage and current from the 3 readings.
I have found out that my prediction is right. The graph is increasing in a diagonal form as from my research so my experiment was a success. At the end of the line graph, the line starts to straighten out a bit. This is not odd as the line is supposed to, due to the heat built up when there is too much resistance. The results that have been taken are about how the resistance is affected by the length of the resistor. The resistance is equal to the gradient of the line as the Y-axis is the voltage and the X-axis is the current. The gradient is the Y-axis divided the X-axis. The reason why the voltage increases as the length increases is because the voltage needs to travel further across the 2 points. The reason why the current decreases when the resistor’s length increased was because there wasn’t enough push for the current to pass through the nickel-chromium wire due to the atoms within the wire blocking the current. Obviously, the resistance will increase if the resistor’s length increases.
Evaluation
In this experiment, the errors that could have occurred were: -
· The length of the wire was not very accurate, as we could have measured the wire off a few millimetres, which could have affected the whole experiment.
· The value on the ammeter and voltmeter could have varied, leading to people writing down different results. This could have affected the experiment because people would have wrote down a higher or lower result for the voltmeter and the ammeter so that the worked out resistance is higher or lower.
· The power supply might have not been turned off during the change of the length of the nickel-chromium wire so heat would build up, leading to more resistance on the next experiment of the increased or decreased wire.
If I were to make improvements to the experiment, I would have tried to make the nickel-chromium wires length as accurate as can be, but in this experiment, there were no extremely odd results.
Another experiment that I could have done that would make the experiment fairer was to keep the resistor under a constant temperature. The circuit would be the same but the resistor would be in an atmosphere where the temperature wouldn’t affect the resistivity of the wire. An atmosphere where the wire would be under constant temperature is under water.
The reason why this way would make the experiment fairer is because there would be no slant at the end of the graph if the results were put into a line graph. Without the constant temperature, there is more resistance if the temperature rises, due to atoms with kinetic energy. With constant temperature, there is the right amount of resistivity there should be, making the experiment a very fair test. Although it won’t be perfect, it will still decrease the amount of atoms moving about when they are hot.
For my conclusion, I have found out that the resistance and the voltage are the same if the current is kept the same and that the resistance and the voltage are in proportion with the length of the wire.