Prediction
I have read about the collision theory and the effect of concentration on rates of reaction in the Collins GCSE Science Total Revision-Mike Smith and Chris Sunley and Chemistry for you-Lawrie Ryan books. I have also researched on some websites-
I used this Website to help me explain the collision theory
- I used this Website to help me explain the activation energies.
From what I know about the collision theory, I can predict what will happen.
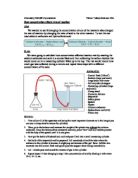
Particles in solutions have kinetic energy and they move around randomly in the space they are held in. Sometimes they collide with other particles of the same or different kind. When particles of different reactants collide they can bond to make new products and a reaction occurs.
For a reaction to happen a certain amount of energy is needed to make reactants bond called the activation energy. If the particles have enough energy when combined to overcome the activation energy “barrier” and are correctly orientated then a reaction occurs and a new product is formed. However, if the combined energy in the particles is insufficient to overcome the activation energy, they fall back as reactants-unchanged and regain their original kinetic energy. You can think of the activation energy barrier a bit like a wall. In order to go over the wall you need enough energy and “push”. If you did not get the position right or you did not have enough “push” or energy then you cannot go over the wall. If you do have the right amount of energy (energy equaling the activation energy or more) then you can go over the wall.
The reaction is slower at a particular temperature when the activation energy is higher.
When particles collide, bond and make new products, it is called an effective collision. It is only when effective collisions occur that reactions happen. The rate of reaction is a measurement of how quickly reactions occur in a period of time or how quickly one of the reactants is used up. The rate of the reaction depends on two factors.
1) The number of collisions per unit time between the reacting species.
2) The fraction of these collisions that are successful in producing a new molecule.
As the second factor mentions only a fraction of theses collisions are successful. Not every collision results in an effective collision. Sometimes they are unsuccessful. Effective collisions happen every so often and not every time. To increase the chance of reactions happening I could change a lot of variables-add a catalyst, increase the temperature, increase the surface area, increase the pressure of a reactant that is a gas, increase the concentration or increase the light intensity. In this experiment I am dealing with only one variable-concentration of one reactant and how it affects the rate of reaction. If I increase the concentration of one reactant, it means I am putting more particles of one reactant into the same volume of solution that is involved in the reaction. This results in more particles involved in the reaction and more particles to collide into. This means that there will be more chances of an effective collision happening, as there are more collisions per unit time.
From this information, I can make a prediction on what will happen if I decrease the concentration of the sodium thiosulphate by diluting it with water. If I dilute the sodium thiosulphate with water and decrease the concentration, there will be less sodium thiosulphate particles in the same volume of solution for the hydrochloric particles to collide and react with, which means less effective collisions will occur. From this, I predict that the rate of reaction of more diluted sodium thiosulphate hydrochloric acid would be slower as there are less reactions happening in a unit of time.
There are some variables that I cannot control easily such as the temperature of the room in which I am carrying the experiment out. It will vary due to the heating, body heat and the temperature outside. Temperature will affect my results as the warmer it is, the more energy the particles in the reactants have. If the particles have more energy they move around faster and will collide more frequently and harder with other reactant particles. If they collide more frequently, there will be more successful collisions in one unit of time. If they collide harder with each other, the activation energy is overcome easily and they react forming new products. This will make my results and their reaction times not as reliable because they were done at slightly different temperatures. I think temperature will be the only variable, which might affect rate of reaction of each of the experiments.
Trial Run
I did a trial run to see if any improvements could be made to my plan and to see if my prediction was as I had predicted.
The results are in this table; I am going to use the same layout with the table for the results I get in the experiment but with the rest of the values of the other experiments filled in.
The results of my trial run were similar to my prediction on what was going to happen-the rate of reaction is slower as the concentration of sodium thiosulphate gets weaker. I also found an improvement I could do to my plan during the trail run. I realised that it was quite hard and fiddly to pour the exact amount of the chemicals into the measuring cylinders from the big containers precisely. I solved this problem by using a funnel. The funnel “focused” the chemicals into the tubing and made the measuring out of liquids much easier.
I also found that the cross on the sheet of paper got wet and it smudges the ink used. In my real experiments I will use a cross that is marked on a piece of paper with permanent ink.. I could also use a plastic wallet to protect the cross.
Changes
I am now going to add a funnel to the equipment list and suggest that you should use it when pouring out the measurements for the chemicals to make it easier and more accurate. I will also add a plastic wallet to the equipment list to protect the cross.
New equipment list
Sodium Thiosulphate (NaSO) of different concentrations Funnel
5cm³ Hydrochloric acid (HCl) Plastic wallet
Water Stopclock
Paper marked with permanent ink cross
2 Measuring cylinders
Conical Flask
*
Results
The hydrochloric acid had been poured into the conical flask containing the sodium thiosulphate and the stop clock immediately started. I observed the solution from directly above the conical flask to judge the time in the best way. I noticed that the solution began to go cloudy and it had a yellowish appearance. The cloudiness started to obscure the cross. Soon the solution of sodium thiosulphate and hydrochloric acid became cloudy enough to obscure the cross completely until it could not be seen. This happened in every experiment but the times for the cross to be obscured completely varied. It took longer for the cross to be obscured when the concentration of the sodium thiosulphate was weaker.
There was also an unpleasant smell of Sulphur. After the liquid had evaporated there was a yellow layer of a substance at the bottom of the container.
I collected 4 sets of results in total to give as many reliable results as possible. By doing 4 sets of results I could spot anomalous results and I can find out why they had happened. 2 sets of the results were done on the same day and the other 2 were done on 2 other days. Each set of results had 5 readings. The range between each reading was the 10cm³ dilution of water added to the sodium thiosulphate solution. This is good range, as it has not got a too bigger gap from the last reading or too minute gap that I cannot detect any changes in the time for the cross to be obscured.
The calculations I used to calculate the rate of reaction was: 1/time for the cross to be obscured.
The 4 sets of results are on the next page.
After having compared the results, I realised that the 2 sets of results done on the same day had quicker times for the cross to be obscured, which has also made the reaction faster. I repeated the other 2 results again but the times were very similar to the original results. I think the 2 sets of results produced on the same day had warmer water, which gave the particles of the solution more energy, this made them move faster and collide more frequently and more effectively to give a faster rate of reaction.
I noticed that the other two experiments that were done on two other days had used colder water. So, this was probably what had caused the time difference between the results.
I am going to use the 2 sets of results that were done on the same day to draw my conclusion, find averages and plot graphs because they are more reliable. - They were done on the same day, and the water and room used was roughly the same temperature. All these factors make the results of these 2 particular sets of results reliable and trustworthy. They will give good graphs and will help greatly in the conclusion of the experiment.
From the 2 sets of results I have averaged the readings (calculation: (1st reading + 2nd reading)/2)
I have used the averaged time for the cross to be obscured and the average rate of reaction to plot 2 line graphs. (I have rounded the time taken for the cross to be obscured to the nearest second so it is easier to plot the graph.) The graphs are on the pages after the results.
The 1st line graph shows how the concentration of sodium thiosulphate affects the time for the cross to be obscured.
At the beginning of the graph, the line has a quite large gradient and is steep. This shows that when the concentration is stronger it makes the time for the cross to be obscured shorter. Therefore it shows a fast rate of reaction when the concentration is stronger. As the concentration gets weaker, the line graph curves and the gradient is less-less steep. This shows that as the concentration gets weaker it takes longer for the solution to obscure the cross; it shows that the rate of reaction is not as fast. Towards the end of the graph the gradient is almost 0- hardly any steepness. This shows that the weakest concentration of sodium thiosulphate in the solution takes the longest time to obscure the cross. This shows that there is a slow rate of reaction.
2nd graph shows how the rate of reaction affects the time taken for the solution to obscure the cross.
The beginning of the line graph is very steep which shows that the time taken for the cross to be obscured is shorter when the rate of reaction is quicker.
In the middle section of the graph, the line curves and the gradient is less. This shows that as the reaction rate is getting slower the time taken for the cross to be obscured takes longer. Towards the end of the graph, the gradient is nearly 0 and the graph is not steep at all. This shows that the reaction rate is very slow which results in a very long time for the cross to be obscured (about 201 seconds).
Conclusion
After carrying out experiments, drawn graphs and having researched I have made a conclusion about how the concentration of one reactant affects the rate of reaction.
Sulphur dioxide was produced in the reaction as the word and chemical equations show. It was Sulphur dioxide, which caused the unpleasant smell.
The precipitate that was produced in the reaction was Sulphur and it was this substance that made the solution cloudy and covered the bottom of the container after the liquid had evaporated.
I know that Sulphur and Sulphur dioxide were some of the products of the reaction of Sodium thiosulphate and Hydrochloric acid from the word and chemical equations.
Sodium + Hydrochloric → Sodium + Sulphur + water + Sulphur Thiosulphate acid Chloride dioxide
Na2S2O3(aq) + 2HCl(aq) -> 2NaCl(aq) + S(s) + H2O(l) + SO2(g)
Water was also produced in the reaction even though I could not tell it was produced.
I also found out that the rate of which the Sulphur was produced varied due to the concentration of the sodium thiosulphate. The more Sulphur produced at a period of time meant that the cross could be obscured quicker as there were more Sulphur particles to cover the cross.
Therefore, the stronger the concentration of one reactant- the quicker the rate of reaction. -(More Sulphur particles are being produced at a quicker rate; the cross gets obscured quicker.) This shows that my prediction and the collision theory involved are true and correct.
My prediction said that if there were more particles of one of the reactants in the same volume of the reacting solution then there would be more chances of the different reactants colliding with each other. However, as I said in my prediction, not every collision is effective so not every particle that collides with another will react and bond to form a new product. But if there are more sodium thiosulphate particles in the same volume of solution for the hydrochloric acid particles to collide with, then there will be more chances of effective collisions that result in a reaction and the making of new products. If there are more effective collisions happening in a period of time then we say that the rate of reaction is quicker. This is because the reaction will take a shorter time to complete when one of the reactants are completely used up.
That is why if I decrease the concentration of sodium thiosulphate by diluting it with water, I am actually putting fewer particles in the same volume of solution. When the hydrochloric acid solution is put with the sodium thiosulphate, there will be fewer chances for the hydrochloric acid to collide with the sodium thiosulphate particles, and even less chances for the collisions to be effective and result in a reaction.
The graphs that I have produced also show that if I decrease the concentration of one of the reactants (sodium thiosulphate) then the time taken for the cross to be obscured completely takes longer.
Why does the graph show this?
We can refer back to the collision theory on why the graph shows that the stronger the concentration of sodium thiosulphate the less time it takes for the cross to be obscured.
If the solution has a stronger concentration of sodium thiosulphate it means that there are more sodium thiosulphate particles in the same volume for the hydrochloric acid particles to react with. There will be more sodium thiosulphate particles for the hydrochloric acid particles to collide with resulting in more effective collisions and a faster rate of reaction. (Shown on the graph by a steep gradient.)
However, if the concentration of the sodium thiosulphate in the solution is weaker then there are less particles of sodium thiosulphate in the same volume for the hydrochloric acids particles to collide and react with. This results to fewer products being produced in a period of time that obscures the cross, which in effect makes the time for obscuring the cross completely longer. (Shown on the graph by a less steep gradient.)
The results and graph show that my prediction that the stronger concentration of one reactant in the same volume of solution makes a shorter time for the particles to react.
The second graph shows that if the rate of reaction is slower then the time taken for the cross to be obscured is longer.
Why does the graph show this?
We have to refer to the collision theory again. The rate of reaction is how quickly a reaction occurs and normally measures how quickly one of the reactants are used up. If the rate of reaction is faster, that means that the reactants are colliding and bonding more in a period of time, which means one of the reactants are getting used up quicker. If the rate of reaction is slow than less particles of sodium thiosulphate and hydrochloric acid are making effective collisions and are reacting. Therefore less of the product is being produced in a period of time, which leads to a long time for it to obscure the cross completely.
The graph and results show that my prediction was correct: the faster the reaction rate, the shorter the time for the cross to be obscured.
*
Evaluation
I think that the experiment I have done has been good as it has produced good results and has helped me come up with a conclusion. But the experiment could be improved upon.
My results were fairly reliable, as they did not contain any anomalous results. They produced a good graph with a smooth line of best fit. This was probably due to the equipment I used to measure the reaction but also to measure the chemicals. If I was to make the measuring out of chemicals more precise, I should use a syringe because the diameter of that is smaller than a measuring cylinder’s.
Even though my results were good the readings were not very similar except the two sets of results done on the same day. Therefore, they are not really reliable. I think in the future I would do all of the experiments on the same day. Most importantly I would have to make sure that the reactants or water used is at the same temperature each time. So in my equipment list I should add a thermometer to check the temperature of the reactants or water. I should also check the room temperature to make sure that the experiments carried out are in the same temperature. This would make them more accurate and reliable.
Doing just this experiment would not really prove for certain that the stronger the concentration of one reactant makes the rate of reaction quicker. I should do another experiment to prove this theory is correct. I have another experiment that I could do to prove that this theory is true-as the concentration of one reactant increases the rate of reaction increases. It is the reaction between hydrochloric acid and marble chips.
Word Equation
Calcium + Hydrochloric → Calcium + Water + Carbon
Carbonate Acid Chloride Dioxide (g)
Chemical Equation
CaCO3 (s) + 2HCl(aq) → CaCl2 (aq) + H2 O(l) + CO2 (g)
By doing this experiment, I can see if my prediction is more certain that it is true. I will decrease the concentration of hydrochloric acid by diluting it with water (like I did with the sodium thiosulphate). Here is the table showing how much water should be added to the hydrochloric acid in order to dilute it:
I will do 5 experiments, each with a varying concentration of hydrochloric acid. This is the only variable I am changing, which means I should keep other variables the same e.g. temperature. I also have to make sure that the surface area of my marble chip is roughly the same as this can affect the reaction-if there are more particles on the outside of the marble chip for the acid to react with, the faster the reaction. In each experiment I am going to time how long it takes for 20cm³ of gas to be collected.
The equipment will be set up as shown in the diagram below:
After having measured out the correct concentration and amount of the acid I will tip it into a conical flask containing the 1g of marble chips. As soon as I do this I will start the stopclock. I will observe the reaction and the amount of gas that is collected in the measuring cylinder. Once 20cm³ of gas has displaced the water in the measuring cylinder, I know that we have collected 20cm³ of gas. Once I notice this, I immediately stop the stopclock and record the time taken in a table set out like this:
I will repeat the experiments at least 3 times to get good reliable results and anomalous results can be spotted. From these results I will average them to get a single reliable reading. I will also work out the rate of reaction (1/time). I will then plot 2 graphs showing the rate of reactions and how it affects the time taken to collect the gas and how the concentration of hydrochloric acid affects the time taken to collect the gas.
From the graph and results I should be able to draw conclusions and see whether if my prediction is correct.
Even though my method of finding how the concentration of sodium thiosulphate affects the reaction rate is good, I have researched another method which can be used for the same experiment but produces more accurate results. It involves a computer with special light sensitive equipment. It records how much light passes through the solution as the Sulphur makes it more and more cloudy. This method also involves machinery that put the reactants together for you. When you choose to do an experiment, the acid is added to the flask containing the sodium thiosulphate solution (the flask is partly covered to stop any stray light affecting the measurements). After a short time, the reaction starts and you will see the light intensity reading on the computer screen change as the Sulphur is formed. The lower the reading, the less light is being allowed through, the more Sulphur is being formed.
I also had a problem when I plotted my graph. I found it quite difficult to join the points with a line of best fit. If I have to plot a graph in future I am going to use a computer as the curves will be smoother and therefore the line of best fit will be more accurate.
All in all I think this was a good experiment but it could have been improved if I used more of the resources available and had more time to do the experiments. The results supported my predictions and they seem to be fairly reliable results.