Apparatus: For this experiment, I need a battery pack (4 batteries), a switch, and a set of wires, an ammeter, a voltmeter, 2 crocodile clips and a pencil lead.
Method: I have chosen this method for this experiment because I think it is a fair and safe way to carry out the experiment.
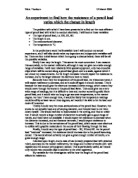
Firstly, the circuit will be set up in a right way as the graph (G1) was shown below, and I will check it before I start the experiment. I will make sure set the ammeter in a series circuit and voltmeter in a parallel circuit, I do this is because the scientific knowledge that is the voltmeter’s resistance is too big to allow the electricity pass through. Secondly, the pencil lead has 15 marks on it and each 1cm apart, I will start the experiment with the 15cm far between two crocodiles, and the distance between two crocodiles will be decreased 1cm each time the reading was taken until they are 1cm apart. I will take the reading of current (amps) and the voltage (volts) each time because the resistance could be calculated out by those two. (Resistance x Current = Voltage) Thirdly, I will take all my results in two decimal places to make the results as accuracy as possible. Finally, I will carry out this experiment 3 times and find the average resistance at last, so that the results I got would be fairly accurate, and it makes this experiment pretty fair as well.
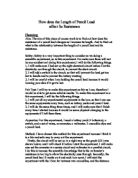
Prediction: I predict that the length of pencil lead will be directly proportional to its resistance, which means the longer the lead have the bigger resistance. This should produce a straight-line graph where resistance doubles when length doubles (see following page). I predict this because the resistance in a conductor is due to collisions between electrons and the particles of the conductor, therefore a piece of lead twice as long as another will have twice the number of particles and the probability for collisions will consequently be double, meaning double the resistance.
This is what I predict the shape of the graph will look like:
Analysing and Concluding:
The graph 1 shows the length of pencil lead against its resistance. My results did not reflect my prediction perfectly well, it shows that they have the directly proportional to each other but it did not show the double length have double resistance. The line has crossed y-axis at 3.9263 that is not right because it should be crossed it at 0. I have found out the equation of my line which is y=1.0295x+3.9263 by mathematical method, I should get the equation y=x but I actually got the plus-3.9263. This is the reason why my line crossed y-axis at point 3.9263, then I minus every average resistance by 3.9263 and I have drawn another graph 2 of those results. It gave me a perfect line that started from point 0 of y-axis, and shows that the double length has double resistance, such as the resistance is 3.4 ohms when the length is 4cm, and the resistance changes to 7.6 ohms when the length changed to 8cm. These results are pretty accurate and proved that my prediction was right. I think the reason of the 3.9263 exists is because of the extra resistance in my circuit, such as wires and ammeter even though there resistance is not that much. However, my graph has shown that the proportionality between the length of it and resistance. The interesting thing was that the lead would get very hot if the distance between two crocodile clips very short, I think it is because the particles collisions, which related to my scientific explanation in the planning. I could work out the resistivity of the pencil lead by this equation- R x A=P x L (R: resistance, A: area, P: resistivity, L: length). (This secondary source is come from the ‘Advancing Physics AS’ textbook)
Evaluation:
This experiment was done well and the aim was achieved, I have got my results but they are not perfectly accurate, and I had explained the reasons in my analysing section. However, I think the method I chosen was still a good and fair method to do this experiment. My results were not far away from the line of best fit and I have drawn the perfect graph in the analysing section, anyway, this does affect my confidence when I am making my conclusion. There still were some anomalous results that were shown on my graph, they did not fit the line quite well. I think this is because I did not wait for the pencil lead cooled down each time after I had done one experiment, because I do not have enough time to carry out the whole experiment once. I think this is the main reason caused those anomalous results, because apparently the temperature is directly proportional to the graphite’s (the material of pencil lead) resistance.
To improve my method to get more reliable results, I will do the following things. Firstly, I will choose something else to instead of crocodile clips, which have more contacting area with the lead; therefore it will allow the electricity passed more easily. Secondly, I will carry out this experiment more time and I will finish all the experiments at the same time, which means I will not do the whole experiment separately.
To extend this experiment, I will do the following steps. Firstly, I would choose the other compositions of the pencil lead to investigate, such as 2B, 4B or 6B. Secondly, I would try to find out how does the thickness of the pencil lead affect its resistance. Thirdly, I could investigate the relationship between the temperature of the pencil lead and its resistance.