∙ Alcohol Thermometer (minus 10°C - 110°C)
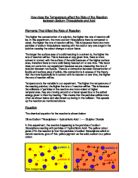
Diagram
Method
∙ Set up the apparatus as shown in the above diagram
∙ Measure 40cm2 of water using a 100cm2measuring cylinder, measure 10cm2 of sodium thiosulphate using a 10cm2measuring cylinder. Measure 5cm2 of hydrochloric acid using a 10cm2measuring cylinder
∙ Pour 40cm2 of water and 10cm2 of sodium thiosulphate into beaker
∙ Heat the solution on a Bunsen flame until the solution reaches just over
40°C (so as to allow for acid to cool solution when added)
∙ Remove beaker from over the flame
∙ Place the beaker over the printed ink cross
∙ Position yourself directly above the beaker so that the ink cross is fully
visible through the solution
∙ Pour the 5cm2 of acid into the solution and simultaneously start the
stopwatch
∙ Keep watching the solution and stop the stopwatch as soon as the cross is
no longer visible
∙ Record the final temperature of the solution in the beaker
∙ Clean all apparatus thoroughly so as not to contaminate the liquids
∙ Repeat this experiment at the 30°C, 50°C, 60°C, 70°C
∙ Record the results in table and graph format
Fair Test
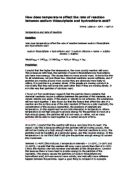
The only variable in the experiment is temperature. To make this a fair test, the apparatus must be thoroughly cleaned before use as a trace of sodium thiosulphate mixed with the acid or vice-versa will cause a reaction, ruining the current experiment. The concentration of the solution must stay the same between each experiment otherwise the experiment will not be accurate. The volumes of liquids must be read off the measuring cylinders given in the apparatus section above. If this is because the accuracy of measuring cylinders varies between size as shown below. The same person must measure the time it takes for the cross to disappear because eyesight of pupils may vary. The time must be measured using the same type of stopwatch, not a wall clock as the accuracies vary.
Possible Errors
The volumes of liquids must be read off the measuring cylinders given in the apparatus section above. This is because the accuracy of measuring cylinders varies between size as shown below.
Safety Considerations
∙ Lab goggles must be worn at all times during the experiment
∙ Pupils must not sit down at a desk near an experiment
∙ Pupils must not crowd round an experiment, only one person is needed to
time the reaction
Safety of Chemicals
If hydrochloric acid is spilt on skin it may cause burns and the affected areas should be soaked in cold water. The acid may irritate the respiratory system, which can cause coughing. If the acid is spilt on furniture, the area should be covered with mineral remover. After the acid has been used in an experiment, it should be disposed with down a waste sink. It is very reactive with nearly all metals and should not be heated. (In the experiment, the acid is added after heating). If pain re-occurs after spillage, seek medical advice.
If sodium thiosulphate is spilt on skin, the area should be soaked in cold water. If spilt on clothes, the contaminated garments should be removed and disposed of. If the liquid gets in a pupils eyes, they should be cleaned thoroughly with clean cold water. When sodium thiosulphate has been used in an experiment, it should be disposed of down a waste sink.
Accuracy of Apparatus
The 10ml measuring cylinder has divisions of 1mm. This enables the accuracy to be read to ±0.5mm.
The 100ml measuring cylinder has divisions of 7mm. This enables the accuracy to be read to ±3.5mm.
The thermometer has divisions of 0.1°C. This enables the accuracy to be read to ± 0.05°C.
The percentage error of a piece of apparatus is found by finding the estimated error, (accuracy), dividing it by the reading taken on the piece of apparatus and then multiplying it by 100%.
e.g
10ml measuring cylinder measured 5ml.
Calculation = ±0.5/5 x 100% = ±10%
Treatment of Results
The results should be written firstly in a results table like the one shown below. From this results table, two graphs should be drawn one with time on the y-axis and temperature on the x-axis and the other with 1/time on the y-axis and temperature on the x-axis. The line should be drawn as a best-fit curve or a best-fit line according to the arrangement of the points. Any anomalous results should be shown on the graph but not included in the drawing of the line
Trial Experiment
The fastest reaction time in the experiment had to be longer than 15 seconds for the cross to disappear, this meant that there had to be a trial experiment carried out to find the best concentration for the experiment. At first, we tried 30ml of water and 20ml of sodium thiosulphate which is a 16mole/dm3 solution. The results are shown below.
After analysing these results, it was concluded that the concentration needed was 40ml water and 10ml sodium thiosulphate solution, 8 moles/dm3.
The results for the trial experiment of the 8 moles/dm3 concentration are shown below.
After obtaining these results we decided that 8 moles/dm3 was the correct concentration to use for the real experiment.
Prediction
I predict that the higher the temperature of the solution, the higher the rate of reaction will be. I say this because the solutions which have higher temperatures will reach their activation energy faster and therefore break their bonds earlier and the cloudy pigment will be released, blocking vision to the cross.
Method
No changes were made to the planning method.
∙ Set up the apparatus as shown in the above diagram
∙ Measure 40cm2 of water using a 100cm2measuring cylinder, measure 10cm2 of sodium thiosulphate using a 10cm2measuring cylinder. Measure 5cm2 of hydrochloric acid using a 10cm2measuring cylinder
∙ Pour 40cm2 of water and 10cm2 of sodium thiosulphate into beaker
∙ Heat the solution on a Bunsen flame until the solution reaches just over
40°C (so as to allow for acid to cool solution when added)
∙ Remove beaker from over the flame
∙ Place the beaker over the printed ink cross
∙ Position yourself directly above the beaker so that the ink cross is fully
visible through the solution
∙ Pour the 5cm2 of acid into the solution and simultaneously start the
stopwatch
∙ Keep watching the solution and stop the stopwatch as soon as the cross is
no longer visible
∙ Record the final temperature of the solution in the beaker
∙ Clean all apparatus thoroughly so as not to contaminate the liquids
∙ Repeat this experiment at the 30°C, 50°C, 60°C, 70°C
∙ Record the results in table and graph format
Calculating Rates
To calculate the rates of reaction, the formula is:
Rate = 1/time
For example, for the room temperature result in Set 2 the time was 199.15s,
1/199.15s = 0.005 (3decimal places)
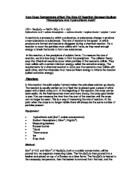
Effects of Temperature on this Reaction
When you increase the temperature, you are giving the particles enough energy to allow them to break their bonds in effective collisions. In higher temperatures, particles collide more often but not each collision has enough energy to break the particle bonds. The minimum energy needed to break these bonds is called ACTIVATION ENERGY. The more we heated up the solution, the more energy we give it to break its bonds and the shorter the time is for it to reach its activation energy.
Patterns
The more heat given to the solution, the higher the rate of reaction. This is because of what is said before about activation energy. The solutions reached activation energy faster because more heat was applied, therefore the reaction occurred and the pigment was given off in the beaker after a shorter and therefore the cross disappeared faster. This is shown by the curve in the time against temperature graph, when the temperature was lower, (18°C), the time was long, (148 seconds). When the temperature was higher, (70°C), the time was shorter (15 seconds).
Prediction and Conclusion
My predictions were correct in the belief that the activation energy would be reached faster in the higher temperature experiments and therefore the reaction would happen faster giving a higher rate of reaction.
Limitations and Improvements
Limitations – The main limitation to this experiment was time, the two points shown before could have been carried out to obtain better results had we had more time. Other limitations in this experiment were caused by the measuring accuracy of liquids being limited as shown in the Accuracy of Apparatus section.
Reliability - We did not have enough time in class to repeat each temperature more than twice so as to make sure no results were anomalous. We would have been able to take an average of all the results for each temperature which would have given us a much more accurate set of results.
Validity - We also did not have enough time to carry out the experiment with smaller temperature gaps, say every 5°C rather than ever 10°C. This would have created a more reliable graph as we there would be more points to plot the line from, we would not be assuming that the line follows a certain curve between points, there would be another point between them that would prove it.
If we were to make an improved experiment that would rule out most human errors, we would use the one shown below.
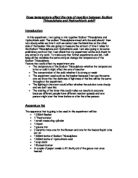
An Experiment to More Accurately Record the Rate of Reaction Between Sodium Thiosulphate and Hydrochloric Acid
Diagram
Method
The clamp stand is positioned to securely hold the light sensing apparatus, which is connected to a 6V power supply. Measured carefully 30cm3 of sodium thiosulphate using a 50cm3 graduated measuring cylinder, and also measure 3 cm3 of hydrochloric acid using a 10cc cylinder. Connect the data logger to the light sensor, and position the light sensor to receive the light of the bulb in the enclosed container. Position a small 50 cm3 beaker in the container between the light sensor and bulb and pour the thiosulphate and acid in. The data logger records the loss in visibility through the solution.