Investigate how mass affects the diameter of an impact crater.
PHYSICS COURSEWORK
ASTEROIDS
Asteroids, also known as small or minor planets are irregular bodies that vary in size and composition. They are usually found in the inner solar system among planets and primarily move in indirect orbits between the orbits of Jupiter and Mars, however some orbit relatively nearby to Earth. This is the prime concern with asteroids; where in the past collision with Earth has had tremendous affects and possibility of future collisions will always exist. This concern has been popularised in many forms and everyday the rate of technology intended to reduce the impact of any likely future asteroid collision is expanding. In order to recreate and demonstrate an increase or decrease in the impact of an asteroid, measurable by its crater size, my outcome variable is: How a chosen factor affects the diameter of an impact crater.
There are many factors that have a form of influence:
Mass - The gravitational potential energy stored by an object is significantly determined by the amount of matter it contains. As the mass increases, the potential increases, hence the kinetic energy increases causing an increase in the size of impact.
Speed - The speed at which a falling object is travelling will have a major affect on the impact of crater. Hence crater size increases with increasing speed.
Height - The speed of the object is dependant on the height at which it is falling. Therefore these two variables are linked.
Air resistance - It is known that small objects have very little air resistance. For example it takes a dropped, small ball longer to hit the surface than a larger ball. Therefore this proves that large objects are affected by a significant amount of air resistance, this will change the way the object moves.
Gravity - Objects are moved by the force of gravity pulling on it. For example gravity on earth would enhance the attractiveness of an asteroid, whereas on the moon, where the pull of gravity is less, the object would take more time to collide with the surface.
Surface medium - The composition of the medium in which an object collides will have an affect on the resulting crater size. An object would have a different result colliding with two contrary mediums, dependant on the content and varying moisture.
Angle of impact - From the craters that have been observed in the past, it has been established that those with a collision at a specific oblique angle were amongst the largest. Therefore the angel of collision has an influence.
Each of the above mentioned factors do have a form of influence to an asteroid collision, however not all can be recreated in accordance to my experiment. Therefore I will rule out each factor that is irrelevant or shows a sign of possible obstruction when it comes to doing the actual experiment.
The first exclusion is the angle of impact. This is primarily due to the reason that it would be too difficult to setup and furthermore beyond measure. The second is evenly between air resistance and gravity. This is logically due to the reason that amongst the apparatus I am provided with to conduct the experiment, these factors would be immeasurable. And last is speed as this isn't actually an input variable, more of an output variable to the height at which an object is falling. Therefore speed is irrelevant and it wouldn't be possible to set the values of speed prior to the experiment. Therefore this leaves me with mass, height and the surface medium all of which can be altered in order to demonstrate an influence.
These 3 factors will all have a form of involvement, however I will primarily only concentrate on one, thus my aim:
AIM: To investigate how mass affects the diameter of an impact crater.
Therefore mass is the independent variable. As an independent variable, it simply means I will need to change the mass throughout the experiment in order to demonstrate a possible influence.
I have chosen mass because I believe this will have a powerful relevance to the shape, size and depth of a crater and also I believe it will be interesting to observe how varying masses affect the diameter of a crater. Also as this is set as an independent variable, I will have independent control over the values I set it to prior to experimentation.
The dependant variable is the variable dependant on others to produce a result and also what I am trying to find out about. Therefore the dependent variable is the actual diameter of impact crater.
And the height and surface medium are set as the control variables. These will need to be kept constant throughout the experiment in order to ensure a fair test as any unexpected alterations during the experiment may affect the accuracy of my results.
BACKGROUND KNOWLEDGE:
For a collision to occur, the colliding object would need to contain energy. Energy is the ability of an object to cause change. In strict scientific terms energy is classified into two main forms: potential and kinetic energy.
Potential energy is energy stored in matter which appears in many different forms, and is defined as the energy in matter due to its position or the arrangement of its parts. The various forms of potential energy include gravitational potential energy.
When something is lifted or suspended in air, work is done on the object against the pull of gravity. This work is converted to a form of potential energy called gravitational potential energy. The gravitational potential energy of an object depends on its mass and the height at which it is falling. This can be demonstrated using the following formula for gravitational potential energy:
U = mgh u= gravitational potential energy, m = mass, g = gravitational constant, and h = height
The formula shows that the gravitational potential energy is directly proportional to both the mass and the height of an object. Hence this shows that the heavier an object is, the more gravitational potential energy it has, and the higher an object is, the more gravitational potential energy it has.
However gravitational potential energy is not the outcome that causes a shock wave. When an object succumbs to the force of gravity, falling towards Earth, it converts all its potential energy into kinetic energy where most of this kinetic energy is transferred to the medium, creating a shock wave, and the rest converted into waste energy which may consist of sound, heat and light. The shock wave would cause the sand to move. This proves that kinetic energy, also known as motion energy, is the outcome energy that actually creates the impact.
Therefore gravitational potential energy is ...
This is a preview of the whole essay
However gravitational potential energy is not the outcome that causes a shock wave. When an object succumbs to the force of gravity, falling towards Earth, it converts all its potential energy into kinetic energy where most of this kinetic energy is transferred to the medium, creating a shock wave, and the rest converted into waste energy which may consist of sound, heat and light. The shock wave would cause the sand to move. This proves that kinetic energy, also known as motion energy, is the outcome energy that actually creates the impact.
Therefore gravitational potential energy is equivalent to kinetic energy which overall depends on how much mass an object contains and the height at which it is falling. This can be demonstrated through the formula for kinetic energy:
K = 1/2 mv? k = kinetic energy, m = mass, and v = speed
The formula shows that kinetic energy is directly proportional to the square of the speed and to the mass. In accordance to my investigation this proves that mass does have a form of influence to the amount of kinetic energy stored by an object, which furthermore determines the impact of collision.
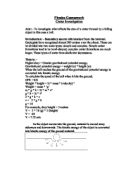
I can demonstrate this with an example using the kinetic energy formula:
Mass of object = 10g
Speed = 4 m/s (constant)
Kinetic energy = 1/2 * 10 * 25
= 20J
Mass of object = 20g
Speed = 4 m/s (same as before)
Kinetic energy = 1/2 * 20 * 4
= 40J
This shows that when I increase the mass the amount of kinetic energy also increases. And the more kinetic energy stored by an object, the larger the impact of collision. Which proves that the more mass an object contains, the more kinetic energy it has which will create a larger impact crater.
A practical example of this would be catching a dropped ball from a building. You would rather wish to catch a tennis ball than a bowling ball, because since the bowling ball is heavier than the tennis ball, it would have more stored energy which would result in a larger collision. This determines my prediction:
PREDICTION: Crater diameter increases with increasing mass.
Below is my predicted trend of results demonstrated as a line graph:
The graph shows that y increases at a constant rate hence meaning an increase in mass (x) will also influence an increase in crater size (y).
PRELIMINARY WORK:
In order to ensure a fair test is carried out and the best possible variables are used hence conduct an accurate experiment; I will need to carry out preliminary work. This will consist of: experimentation of height, surface medium, and mass.
To produce reliable results I will need to ensure that only one of the variables is changed at a time and each recording is repeated three times. From this I should be able to calculate an average which will help me in selecting a reasonable criterion for each variable.
Height and surface medium will need to be experimented in order to determine the most advantageous constant height at which the object will be dropped from to use and the optimal directed surface where the ball will land. This is to ensure these variables compliment and help produce accurate results when varying masses. For example if I unreliably choose to use a constant height of 30cm without any preliminary work, a problem may arise during the experiment where there isn't a major difference between the range of results for the varying masses, which wouldn't produce results as intended.
The independent variable, mass, also needs to be covered in my preliminary work to determine the best range of values I will set it to for the actual experiment. Also this will make it easier for me and save time later as I would already be familiar with the composition of the balls and its masses.
Preliminary work will also allow me to identity any arising problems at an early stage and determine the required apparatus needed to complete the experiment.
Preliminary results:
Varying height
HEIGHT (CM)
SURFACE MEDIUM
MASS (G)
CRATER SIZE (MM)
2
3
Mean
20
Fine aquarium gravel
Golf ball (42)
65
64
63
64
40
Fine aquarium gravel
Golf ball (42)
86
86
87
86.33
60
Fine aquarium gravel
Golf ball (42)
93
93
92
92.66
The table shows that as the height at which the ball is dropped from increases the crater size also increases. This is demonstrated as a line graph. Refer to graph 1.
I have added a curve of best fit. This shows that the average crater size tends to increase as the height is made higher, which proves that height has a form of influence to the crater size. Therefore, in order to conduct an accurate experiment, the height will need to be kept constant.
In addition, from these findings I have decided I will use a height higher than the ones experimented. This will allow me to notify the trend of varying mass in detail.
Varying surface medium
SURFACE MEDIUM
HEIGHT (CM)
MASS (G)
CRATER SIZE (MM)
2
3
Mean
Fine aquarium gravel
50
Golf ball (42)
91
91
92
91.33
Silver sand
50
Golf ball (42)
93
94
93
93.33
Fine sand
50
Golf ball (42)
94
94
94
94
As can be seen from the table, there is not much difference between the crater sizes produced when the golf ball is dropped into different surfaces mediums. However if my intervals of height were higher then more disperse results would most likely be produced.
Varying mass
MASS (G)
HEIGHT (CM)
DIRECTED SURFACE
CRATER SIZE (MM)
2
3
Mean
Ping pong (2.6)
50
Fine aquarium gravel
42
42
40
41.33
Steel ball (29.1)
50
Fine aquarium gravel
64
62
63
63
Golf ball (42)
50
Fine aquarium gravel
92
93
92
92.33
As can be seen from the table, mass has a significant affect on the crater size. This is also demonstrated in a line graph. Refer to graph 2.
The graph shows that the crater size (y) increases by a significant amount for each of the increasing masses (x) used. Also as can be seen, a curve is formed which argues my prediction is incorrect. Nevertheless it is far too early to validate this since there is insufficient evidence.
I found that all the balls available to conduct the experiment have masses of varying assortment. This will make it difficult to produce results that have comparable trends and relationships and more importantly this will not give me independent control over the values. Therefore I have decided to use plasticine constantly through the experiment where it is possible to alter the mass to a range required.
By means of altering the mass for each recording I will be able to pre-set the intervals by 5g.
The outcome and decisions made from the findings of my preliminary results, in accordance to the actual experiment, can be found below:
Dependant variable - Crater size
Value = Millimetre (mm) 3 recordings for each varying mass
Measurement method = Vernier caliper
Independent variable - Mass
Value = Grams (g) 5-35
Measurement method = Electric scale
Control variable 1. Height
Value = Metre (m) constant
Measurement method = Metre ruler
Control variable 2. Surface medium
Value = Fine aquarium gravel (constant)
There are many elements to ensure a fair test is carried out. All recordings will be repeated three times; this will allow me to identify any recording that doesn't follow the usual trend and furthermore calculate an average. Secondly I will need to ensure the experiment is conducted in one lesson, as continuing the experiment after setting up the apparatus over again may alter some of the constant variables therefore there may be a possibility of unreliable results. And caution will need to be taken when measuring the crater sizes, as a mere mismatch of measurement may be unreliable.
METHOD:
I am now able to verify the apparatus needed to complete the investigation:
* Large plastic tray
* Fine aquarium gravel to fill the tray
* Plasticine
* Meter ruler to measure height
* Two stand, bosses & clamps to hold metre ruler and plasticine ball
* Standard ruler used for leveling of aquarium gravel
* Electric scale to measure mass of plasticine
* Vernier caliper to measure crater size
* Safety goggles (optional)
* Set square (optional)
Below is a diagram showing how the apparatus should be set up:
The following steps will need to be carried out in order to conduct an accurate and more importantly successful experiment:
. Begin by setting out the apparatus as shown in the diagram above. It is required that 1/3 of the plastic tray is filled with the provided fine aquarium gravel.
2. Ensure that the vacant boss of the clamp (right) is positioned directly above the surface so an attached ball will fall directly below onto the surface.
3. Knowing the first range of mass is 5g, using the plasticine adjust the size until the mass totals 5g on the electric scale.
4. Tighten the plasticine ball to the vacant boss of the clamp ensuring that it is positioned at 1m height. A set square placed against the stand can be used to ensure the ball is placed at a straight angle.
5. Using the standard ruler provided smooth the fine aquarium gravel so it is level.
6. Now ensuring that the boss holding the plasticine is positioned at the correct height (1m), the plasticine is placed at a straight angle and the surface is smooth, loosen the boss and the plasticine should fall onto the surface using the force of only gravity.
7. Without putting any pressure on the ball, remove it from the surface.
8. Finally using a vernier caliper measure the diameter of the created crater. The result of this should be recorded into your results table.
9. In order to produce the most accurate results possible, repeat stages 3-8 twice more using the same mass of plasticine. However it is required the mass of plasticine is measured again as this may have distorted during the first recording.
0. Repeat the whole experiment again but stage 3 should be altered so the mass of plasticine is 5g heavier than the one before. This procedure should continue until you have recorded final results for 35g.
Safety is not a major factor to take into consideration. However it is optional to wear safety goggles in order to avoid a rare occasion of any fine aquarium gravel coming into contact with eyes. And as usual general safety will need to be carried out.
RESULTS:
PLASTICINE MASS (G)
HEIGHT (CM)
DIRECTED SURFACE
CRATER SIZE (MM)
2
3
MEAN
5
00
Fine aquarium gravel
44
45
46
45
0
00
Fine aquarium gravel
52
53
53
52.66
5
00
Fine aquarium gravel
64
62
64
63.33
20
00
Fine aquarium gravel
66
67
67
66.66
25
00
Fine aquarium gravel
74
77
74
75
30
00
Fine aquarium gravel
79
81
79
79.66
35
00
Fine aquarium gravel
81
83
82
82
As can be seen, each recording was repeated three times. This was to ensure the most accurate results were produced and with three sets of recordings this would allow me to calculate an average.
There weren't any unexpected arising problems whilst conducting the experiment.
ANALYSIS:
Now that I have completed the practical experiment and results have been recorded, I am able to analyse the results and come to a conclusion in contrast with my set prediction.
I will begin by producing a scatter diagram showing all the recordings. This will allow me to observe the accuracy of results and also, through a visual display, identify any possible recordings that don't follow the usual trend. Refer to graph 3.
The scatter graph shows positive correlation allowing my prediction to stand true that crater diameter increases with increasing mass. Furthermore I have added a curve of best fit which suggests that crater size increases at a decreasing rate.
In order to distribute the recordings further and more importantly notify a relationship I will tabulate and produce a line graph showing the average crater sizes crated against increasing mass.
PLASTICINE MASS (G)
AVERAGE CRATER SIZE (MM)
5
45
0
52.66
5
63.33
20
66.66
25
75
30
79.66
35
82
Refer to graph 4.
The basic trend of the graph shows that as the mass increases so does the average crater size formed, which partially proves my prediction is correct. However the curve of best fit shows that the average crater size (y) is directly proportional to the square root of mass (x). Whereas my predicted graph showed that (y) was proportional to (x). This proves that my predicted graph is wrong.
Also as can be seen from the graphs three and four, a flattening curve is produced towards the end. The only reason applicable for this is air resistance. The external influence of air resistance causes the plasticine balls to fall at different speeds, and the terminal velocity, the maximum velocity that can be reached by a given object, is determined by its drag in contrast to its weight. The drag depends on its shape and area. Hence the flat curve demonstrates the point at which terminal velocity has been reached.
In order to validate that crater size is proportional to the square root of mass I will produce a line graph showing the relationship between two. The calculations of the square root of mass are also tabulated below.
VMASS (G)
AVERAGE CRATER SIZE (MM)
2.23606798
45
3.16227766
52.66
3.87298335
63.33
4.47213595
66.66
5
75
5.47722558
79.66
5.91607978
82
Refer to graph 5.
As can be seen from the graph the crater size increases at a constant rate which proves that crater size is proportional to the square root of mass. Although the points do not form a perfect straight line, using the line of best fit it is possible to determine the sizes of craters produced by any given mass.
For example a Vmass of 2g would form a crater size of 40mm. And by squaring the Vmass of 2g, it is possible determine the actual mass of the object that caused the impact crater.
In this case:
* Vmass = 2g
* Vmass of 2g? = 2g x 2g
* Therefore mass = 4g
From the results it is also possible to work out the gravitational potential energy stored by the falling plasticine at the point of release using the formula:
U = MGH
M = mass is the varying input needed to calculate the formula
G = gravitational constant is known to be rounded off to 10
H = height is constant at 1.0 metre
Therefore... U = M (varying input) x 10 x 1
U = m10
The calculations are tabulated below, as well as the average crater size:
G.P.E. (J)
MASS (G)
AVERAGE CRATER SIZE (MM)
50
5
45
00
0
52.66
50
5
63.33
200
20
66.66
250
25
75
300
30
79.66
350
35
82
I have also produced a line graph to determine a possible relationship between the average crater size and gravitational potential energy. Refer to graph 6.
The curve of best fit shows that the crater size increases as a decreasing rate, which forms a relationship of y= Vx. And as mentioned in the background knowledge, gravitational potential energy = kinetic energy; therefore I would expect the kinetic energy of the object to also be proportional.
In order to demonstrate this, below is the kinetic energy calculations tabulated and the average crater size is also displayed.
K.E. (J)
MASS (G)
AVERAGE CRATER SIZE (MM)
49.95
5
45
99.9
0
52.66
49.85
5
63.33
99.8
20
66.66
249.75
25
75
299.7
30
79.66
349.65
35
82
The kinetic energy was calculated using its formula:
K = 1/2 mv? k = kinetic energy, m = mass, and v = speed
However it isn't possible to use the formula to make calculations without initially knowing the speed. Therefore the speed had to be calculated using the following formula:
V = V2gh g = gravitational constant (10) and h = height (1 metre)
= V2x10x1
= V20 = velocity / speed
= 4.47m/s (rounded to 2d.p)
The speed, 4.47m/s, was then applied into the kinetic energy formula.
I have produced a line graph of the kinetic energy calculations. I would expect the line graph to show the same trend as seen in the graph of gravitational potential energy against crater size.
Refer to graph 7.
Similar to the graph of gravitational potential energy against crater size the relationship is in the form of y= Vx. This validates that gravitational potential energy is proportional to kinetic energy and both of which, when square rooted, are proportional to the size of impact crater.
In order to display a visual demonstration of the proportionality of gravitational potential energy and kinetic energy, below are the calculations tabulated and then presented as a line graph. Refer to graph 8.
G.P.E. (J)
K.E. (J)
50
49.95
00
99.9
50
49.85
200
99.8
250
249.75
300
299.7
350
349.65
The graph may show that gravitational potential energy and kinetic energy are relatively proportional, but as can be seen from the table above, there are insignificant variations between the two. Possible cause for this is the accuracy of the values. For example when calculating the speed, the result was rounded to two decimal places. This could count up for the mere difference.
Overall from the analysis I have found that my prediction was partially correct. I predicted that crater diameter increases with increasing mass, which is correct. However the produced graph in my prediction was of a straight line, where-as the actual results formed a curve with the relationship of y = Vx. Thus I have discovered that crater size is proportional to the square root of mass.
Also with reference to my background knowledge I proved that the gravitational potential energy stored by the plasticine at the point of release is proportional to the kinetic energy transferred to the surface medium. This was due to the fact that the energy was transferred between the two, where the total amount of energy remained the same.
EVALUATION:
Accuracy:
As can be seen from the graphs produced from the results taken, there are no recordings that disperse away from the usual trend. Even though there may be one or two at times that are not as attached as the others, these cannot be described as anomalies. Thus there are no anomalies present. This is primarily due to the reason that great carefulness was kept in consideration whilst conducting the experiment. This consisted of many aspects:
* The boss, attached to the clamp, holding the plasticine was positioned at 1 metre whilst setting up the apparatus and wasn't changed at all during the experiment. Therefore I am certain each plasticine recording had been dropped from the same height. Furthermore this proves that there wasn't a dramatic change in gravity or air resistance acting on the falling plasticine, all remained the same.
* The surface medium was kept constant throughout the experiment, and I made every possible attempt to keep the depth of the fine aquarium gravel the same. And furthermore, keeping in mind the restrictions of time for the experiment, after each recording of crater size the best possible effort of leveling the surface equally was made.
* A vernier caliper was used to measure the formed crater sizes which increased the accuracy of the measurements by a significant amount, as using a standard ruler would have been inaccurate and therefore would have produced unreliable results.
* Each recording was repeated three times initially to ensure that if a fault had affected one of the recordings, this would be noticeable by the repeats. Even though none of the recordings had an influence of obstruction, the repeats helped to distinguish the accuracy of results.
Because there aren't any anomalies present doesn't indicate the accuracy of my results are one hundred percent. There are a range of factors that could have affected all my recordings, but do not influence a change in trend as these would simply add constant to my results. Possible factors are:
* Friction - when kinetic energy was transferred from the falling plasticine to the surface, this would have caused the fine aquarium gravel particles to move, collide and rub against each other which would have caused the particles to travel a smaller distance due to the friction reducing its velocity.
* Energy transferred to compress the surface - as mentioned above, great effort was taken to ensure the surface was smooth and equally leveled before releasing the plasticine, however it is possible a fair amount of air was trapped in-between the layers. As required the energy from the impact would have compressed the sand to form a crater, but this would have also caused general compressions of the surface in the whole tray. Also a small fraction of energy would have been in the form of waste to sound.
* A more practical influence would have been the constant height. When the boss for the plasticine was positioned, it may have not been precisely 1 metre as the metre ruler was placed on the opposite side.
Reliability:
In addition to the scopes of errors mentioned above, there are many other incontrollable factors that may have had a form of influence or obstruction. However no significant problems or difficulties were encountered whilst conducting the experiment.
Even though the results of my experiment do not agree with my set prediction, my results and conclusion were accurate and reliable enough to verify a relationship that crater size is proportional to the square root of mass. I was also able to determine that crater size is proportional to the square root of gravitational potential energy and kinetic energy and moreover prove that gravitational potential energy and kinetic energy are approximately proportional.
Improvements:
No matter how accurate produced results are, due to the restriction in apparatus provided and the time to complete the investigation, improvements will always be applicable. Possible improvements:
* The accuracy of using a vernier caliper to record results was overwhelming; however diversified professional equipment would develop beyond this. For example using an electronic tape measure it would not only measure the crater size formed, but would also calculate other useful related information to the result using its built-in functionalities. A more manageable form of measuring accuracy would be using a piece of string to line the crater and then measure the string using a ruler, thus working out in-depth dimensions of the crater.
* Knowing that I only experimented three heights during my preliminary, and in addition none of these heights were actually used in the experiment, it would have been useful to experiment a wider range of heights before determining the constant.
* Even though three repeats for each recording was accurate enough to produce a reliable average, increasing this to five or six recordings may have bought about possible impediments of restriction which could have then been analysed.
Extending the investigation:
* It would be useful to extend the range of masses investigated and see if the observed trend continues.
* As mentioned at the opening of my coursework, an angle of impact would have a dramatic affect on the crater size formed. Therefore it would be interesting to observe the results when varying the angle of falling objects, but as justified earlier, this cannot be conducted in a classroom with the provided apparatus therefore this would have to be setup elsewhere with better equipment.
* Another form of extending the investigation, primarily out of curiosity, would be varying the shapes of objects with the continuous variation of masses which would expectedly form unusual, interesting results.
APPENDIX:
Internet sources used to construct my background knowledge:
* http://www.geocities.com/j31645/15.html
* http://www.uwsp.edu/cnr/wcee/keep/Mod1/Whatis/energyforms.htm
* http://phun.physics.virginia.edu/topics/energy.html