The experiment will be done twice or three times if possible and the results will be made fair by the fact that only one thing will vary each time. Averages will be taken to improve the credibility of the findings and prevent solid grounding for the final conclusion.
If one set of results is entirely different to the others, a fourth experiment will be performed to replace the anomalous set of results.
I will use the same standard each time for judging when the X has disappeared to make it a fair test.
A pair of goggles will be worn to protect the eyes. A lab coat will be worn to protect the skin and clothing. When handling hot beakers and measuring cylinders a pair of tongs will be used. A gauze and heatproof mat will be used while heating to avoid any damage to the equipment.
METHOD
- Collect apparatus and pout the reactants into a beaker each. Put the X underneath conical flask.
- Heat suspension or cool suspension of sodium thiosulphate to the desired temperature.
- Immediately add Hydrochloric Acid.
- When the precipitate has turned so cloudy the X cannot be seen to stop the clock.
- Repeat twice more and record results.
The rate of reactions were rounded up and given to two significant figures so that impossible numbers were not being dealt with. The results were initially taken down on graph paper so that it was easier to pick out the anomalous results. The graph is included on the next page, but only shows temperature and time, not the rate of reaction.
Two of the results had to be done again because they were anomalous results, and I wanted to improve the accuracy of my experiment and investigation, so that my results too would be accurate. The results shown, however, in the previous table were the correct ones with the new-recorded rates of reactions and times.
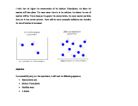
ANALYSING THE DATA
Conclusion: From the results it is possible to observe that as the temperature is increased the time taken for the reaction to take place decreases. This means that the rate of reaction increases as it takes less time for the reaction to take place. In the ‘time’ graph (the graph showing temperature against time) the points have negative correlation. The graph, however, that shows temperature against rate of reaction has positive correlation – as the temperature increases so does the rate of reaction. This is because when the temperature is increased the particles will have more energy and this move faster. Therefore they will collide more often and with more energy. Particles with more energy are more likely to overcome the activation energy barrier to reaction and thus react successfully.
Comparison: The conclusion that I have been able to draw from this experiment strongly agrees with the prediction that I made before starting the experiment in my plan. They both say that as the temperature increases, so does the rate of reaction. This is based on the collision theory. Therefore my prediction was correct, as it was exactly the same as the conclusion. This shows that I managed to use my scientific knowledge to make an accurate prediction.
Explanation: When gases or liquids are heated the particles gain kinetic energy and move faster. The increases speed increases the chance of collision between reactant molecules and the rate then increases. However, this is not enough to result in a drastic chemical change. Before any change takes place on collision, the colliding molecules must have a minimum kinetic energy called the Activation Energy. It does not matter whether the reaction is an exothermic or an endothermic energy change. When heated molecules have a greater kinetic energy, a greater proportion of them have the required activation energy to react. This increased chance of higher energy collisions greatly increases the speed of the actual reaction.
EVALUATING THE EVIDENCE
Results: Whilst the initial graph reflected the fact that there were two anomalous results, I was able to do those temperatures again and so ended up with what are reflected on the graphs as almost completely accurate results. The graph shows a very prominent curve on it. The explanation for the two anomalous results is that the beakers were not washed thoroughly enough and so therefore the reaction had begun before the stop clock had been set. This was quickly changed and much more thorough cleansing of the beakers took place.
Accuracy: The results that I obtained are fairly accurate, despite the fact that initially there were anomalous results. They were however re-done so that accuracy could be at its possible optimum for this particular experiment. I think that it is fair to say that these accurate results were obtained by measuring the fairness of each individual test. In the end, however, I only did the experiment once because I was satisfied with the accuracy of the results that I was obtaining.
A way of improving the experiment would be to use separate beakers for each different test so that all chance of there being Hydrochloric Acid already in the beaker. This would be far more efficient than simply washing the beakers in between trials. This would prevent cross-contamination.
Another way in which I could have improved the experiment was to do a greater range of temperatures. I stopped at 70 degrees because in my preliminary experiment it was discovered that any higher took considerably more time. For the time period that I had in which to conduct my experiment I felt that the range was suitable, but that more temperatures in between could improve the evidence and its solidarity. It would also help to single out anomalous results with more ease.
I would also make sure that the thermometer was placed in the middle of the liquid for each test, to make sure that each experiment is carried out under the exact same rules.
I would be even clearer about when the reaction was done, as this would also improve the accuracy of the experiment and the fairness of each trial.
Possible Extensions: To expand the experiment there are certainly things that I could add and employ to make the experiment more constructive and also more explanatory on the effects of different variables on the rate of reaction.
I could perhaps investigate the effect on stirring on the rate of reaction as well. After all, stirring the mixture is an important rate factor.
I could also investigate the effect of surface area on the rate of reaction. I could test my hypothesis that id a solid reactant is broken down into smaller pieces the rate of reaction increases.
Another experiment I could do in order to expand this experiment is the effect of concentration on the rate of reaction, or even the effect of pressure.
I could also try the experiment with different acids to see if they also made a difference and to see whether or not there was a reaction with them at all, and if so what it was.
I could also use more accurate equipment so that better results and more evidential, solid results could be obtained. Bunsen Burners are not brilliant for achieving certain temperatures.