Strategy
Technology is moving so fast and so Photovoltaic cells are the new way forward. A common topic which has been in the news for the last decade is different ways of making renewable energy instead of burning fossil fuels. Only recently has the photovoltaic industry become high in demand. Therefore for my science investigation I have decided to study solar cells and how the surface area affects the amount of electricity produced.
My independent variable will the surface area of the solar panels. The reason I chose to investigate the size is because I want to understand whether buildings with a small roof would produce more or less or even the same amount of electricity as a building that has a roof with a large surface area. This will also help me understand whether buildings with a small surface area are at a disadvantage and are unable to produce as much electricity. There are other factors which I could investigate, one of which is the amount of light that the solar cells receive. The way I would change this is by changing the wattage of the light bulb, so it starts of bright and gets dimmer. If there is more light present then the intensity of the light would change. This would then affect the amount of electricity that is produced. Another variable which could have been changed is the distance of the light to the solar cells. The reason I chose not to look into this variable is because everything is approximately the same distance from our planets’ main light source; the sun. The final variable I considered was the angle of the light between the solar cells. The reason this could have been an interesting variable to study is because the sun shines from different angles throughout the day. However, from my research I have discovered that advanced solar cells are able to store the electricity they generate so in reality the time of the day would not have much of an effect on the amount of electricity produced.
My dependent variable will be the voltage; this will be measures using a voltmeter. The reason I have chosen to measure voltage instead of current is because voltage is a measure of the energy carried by the charge and current is the rate of flow of the charge. As I want to investigate how much electricity is being produced I will measure the voltage. To make my experiment fair I will used the same lamp so that the bulb does not have an effect on my results. I will also ensure that I used the same wires to connect my voltmeter to my solar cells, so that is there is a difference in the wires it will not effect the end result. I am aware that external factors may make my experiment unfair and even inaccurate. To overcome this problem I have decided to do my experiment in a cardboard box. This will hopefully eliminate any light that is not coming from the lamp. If it was practical it would be ideal to do the experiment in a pitch black room. Even though light may seep through the gaps in the cardboard box it will be to a minimum.
The apparatus I will need are; various sizes of solar panels so that I am able to vary my experiment and gather a full range of results. I will also need a lamp; this will act as my light source. To measure the voltage I will use a voltmeter. I will need wires and a cardboard box to eliminate any background lighting. I have decided to take eight measurements, this will then be repeated three times to ensure my results are reliable and so that any outliers can be detected.
Method
- Firstly, clear the workspace to ensure that no hindrances are present.
- Collect the following: a lamp, two wires, two crocodile clips, 4 various sized solar cells, a voltmeter, a cardboard box (approx size 1’ x 1’), black paper, a stopwatch, cellotape.
-
Cover up part of the smallest solar cell so that the surface area is 4cm². This is the smallest measurement I will start with.
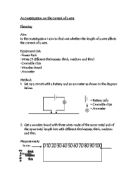
- Then set up the experiment so it is a circuit. (See diagram).
- Ensure that the lamp is directly focused on the solar cell so that the solar cell gets us much light as possible.
- Measure the distance of the lamp to the table, so that the distance of the light source can be taken into account when interpreting the results.
- Put the cardboard box over the circuit, including the lamp to ensure that any background lighting is eliminated. Keep the voltmeter out so that the reading can be taken.
- Turn the light switch on and at the same time put the stopwatch on and take the reading after 5 seconds. This would have then given the voltmeter time to get a set reading.
- Record the reading and turn off the light switch so that the lamp does not get too hot which can then become dangerous.
- Then repeat this twice to ensure that the results are reliable and so that later on any outliers can be detected.
-
Repeat the experiment seven more times with different measurements. Ensure that each surface area is tested three times.
Preliminary Results
Whilst carrying out my preliminary experiment I noticed that my results were not following a pattern and were uneven. I realised that the reasons why my results were not forming a sequence because I was using different solar cells. Each solar cell acts as a battery, this means that the solar cell may work differently to another. The voltage was changing at uneven rates which were not showing a regular sequence. My results were not consistent because I was using a different solar cell which meant that it was not a fair test. To ensure that my test was fair as possible I made the following changes:
-
I decided to use one solar cell with a surface area of 54cm². I chose to cover parts of the solar cell with black paper so that I could increase the exposed surface area. As I would not be changing my apparatus the test would be fair.
- I also drew an ‘X’ on the table so when I was changing the paper I would put the solar cell back in the same position on the table.
- I also drew around the solar cell on the table so I would put it back in the same place.
- I also changed how long I would wait to take the reading. In my original method I decided 5 seconds but changed this to 10 seconds so the reading would have longer to set.
-
I also changed the various surface areas I was measuring. I decided to go up equally by 4cm². By changing the surface area equally I will be able to pick up on any patterns more easily.
(Setup of experiment)
Actual Results:
Interpretation
(See graphs).
The graph is clearly showing a trend which is a positive correlation; as the surface area increases the voltage produced increases. Even though there is a link between x and y my graph is not directly proportional. I know this because the voltage produced does not increase at a certain rate as the surface area of the solar cell increases. For example, when the surface area is 4cm² the voltage is 0.23. When the surface area is 8cm², the voltage produced is 0.34. This evidently shows that when the surface area is increased, the voltage produced is also increased but not at an even rate. Also for my graph to be directly proportion a straight line would have to go through the points (0, 0) which it does not. So x is not directly proportional to y.
I also considered if my graph was linear. As the line of best-fit I have drawn is curved (as is most appropriate), my graph cannot be linear. I also considered whether the graph is inversely proportional. The formula to work this out is . Where K is the scale factor. This is not the case with my graph so my graph is not inversely proportional. Furthermore, I decided to check if my graph was an exponential graph. The formula for working that out is y= ka^x.
My graph curves most steeply from when the surface is area is 4cm² to when the surface area is 8cm². The reason for this could be because the light was hitting more cells and therefore the cell could use more of the light source. After this my graph starts to curve more gently and seems to level of towards the end. In my graph there are four range bars; this is where the there was a difference in the reading on the voltmeter. The spread of the range bars is fairly small. The reason for these slight differences in results could be because I could have moved the wires slightly or there could have been a gap in the box which could have allowed a very small amount of background lighting in. From the measurements of 8cm² to 28cm² the gradient is very mild and the voltage increases slightly. Once the surface area is 28cm² the voltage levels of and becomes constant. The reason this could be is because the intensity of the light is so strong and close to the solar cell that no more of the solar cell receives the light. The readings could be different and may have continued increasing if the lamp was further away from the solar cell.
To conclude, my graph is showing that as the surface area increases the voltage produced also increases but when the surface area gets to a certain point, in this case 28cm² the voltage being produced levels of. In reality, the sun is a great distance away from building roof tops so the sun will not be intensified on just a certain area of a solar cell.
The following results were obtained from a fellow peer (Sarah Richards) as secondary data to back up my conclusion. As you can see we both investigated the same variable and these results show that as the surface area increases the voltage produced also increases. So this supports my conclusion. The voltage increases but the readings are slightly lower, the reason this could be is because Sarah had her lamp 16cm away from the solar cell whereas I had mine 15cm away from the solar cell.
Evaluation
When I carried out my experiment I recorded 8 results, three times so altogether I recorded 24 pieces of data. I felt that these were enough results to draw a conclusion for my experiment, but on a wider scale I should of recorded results up to a larger surface area to see if the results continued to stay level. I believe that my results were fairly accurate as I marked a spot of the desk to ensure that the solar cell went back in the same place. I would often check that the distance of the lamp was till the same. I use the same voltmeter so that the voltage was measured by the same piece of equipment at all times. In general my results were reliable as I had few range bars and for the measurements I had range bars for they were extremely close together. My results fit clearly into a trend; which is rising although I was surprises that my results levelled of towards the end and stopped increasing. There were no anomalous results; this shows that my apparatus was reliable. I would like to repeat the last few results to ensure that they were suppose to level of. The first piece of data just not follow the gradual rising trend as the rest but this is because it is the first piece of data and the surface area was very small. I repeated my experiment twice and they seem sufficiently reliable to each other; the range bars are fairly insignificant. My conclusion explains my results which are consistent and follow a tendency. My results are reliable but I do not believe that they cover a big enough range to make a firm conclusion. The reason I was unable to investigate a larger surface area is because there was not any bigger solar cells or I would have investigated up to a larger surface area. This would have made my results more reliable and I would have been able to have made a firmer conclusion. Nevertheless, I am still able to make a strong conclusion from the data that I have collected.
When I started to follow my method, I encountered I few problems which I managed to sort out. At first I was using different solar cells which were not forming a pattern and were uneven. The reason for this was because each solar cell was slightly different and therefore may have worked slightly different to the other. To overcome this problem I used the biggest solar cell and covered parts of it with black paper this meant I was using the same piece of equipment which made my work even fairer. My equipment was appropriate for the task, but I would have preferred to have had a bigger solar cell but there was not one available. If I had a bigger solar cell then I could have studied the surface are when it was larger. I managed to keep the factors I didn’t investigate controlled. To ensure that the distance of the light stayed the same I measured the distance from the lamp to the table every time I was going to repeat the test. I did not move the lamp so that the angle of the lamp did not affect my results. Another variable which I had to control was the strength of the light on the solar cell; I did this by keeping the same bulb throughout the experiment. My results were precise as I used a voltmeter which is the correct piece of equipment to measure voltage. It was precise as it measured up to two decimal places. The results are fairly accurate because the equipment I used was reliable. To make my results more accurate and reliable and would repeat the experiment five times total.
To further my investigation I would look at larger surface areas to make my conclusion more certain. If I extrapolated straight from my graph the measurements would stay level but if I continued the investigation in reality the voltage produced would increase. Overall, I believe that my investigation was a success.
References to my research:
- http://www.solarage.co.uk/PV.htm