Preliminary work
Step by step method
- Set the apparatus up on one of the workbenches, near a plug so you can connect the wires to it. It is shown in the diagram:
-
Write out the results table.
- Record thickness of the wire.
- Attach the crocodile clip to the wire at every 10 cm and measure the voltage and current for each.
- Plot the results that you got for the voltage and current in a table and put the average.
- Repeat the above five times.
Results
Voltage (v)
We did check the Amps between the results but the numbers stayed consistent as expected because the circuit and the flow of current are constant.
When we first did the experiment, we found that the wire got really hot and started burning and our results were all over the place. The current was varied and there was a big difference between the voltages. We decided to add a variable resistor to our apparatus as it will help reduce the current and help stop the wire from burning. The variable resistor helped a lot because the second time we did the experiment, the wire didn’t burn and the voltage and current was much more steady and at a certain number. This is shown above in the table.
Doing my preliminary experiment was helpful towards our decision of what we were going to do for our actual method. We found that measuring at every 10 cm didn't give us a big difference in numbers. It also didn't give us reliable results so when it came to our method, we decided to measure at random using these measurements; 10, 25, 40, 55, 70, 90. These measurements aren't equal and go up in the times table. Having random results will hopefully give us more variation and a difference in numbers in our results. Another thing that we actually forgot to do in our preliminary experiment was using different wires. We only used a constantan wire for these results so when it comes to our method, we will use these wires:
- Copper
- Manganese
- Constantan
- Nickel chrome
Using four different wires will give us more reliable results as they are all the same sizes so we will be able to see if the resistance changes or not in each wire.
Apparatus
- Constantan wire on ruler- to connect with wires and see how high or low the resistance is when the electrical current flows through it.
- Copper wire on ruler- to connect with wires and see how high or low the resistance is when the electrical current flows through it.
- Manganese wire on ruler- to connect with wires and see how high or low the resistance is when the electrical current flows through it.
- Nickel chrome wire on ruler- to connect with wires and see how high or low the resistance is when the electrical current flows through it.
- Voltmeter- will tell us how much voltage is flowing through the wire.
- Ammeter- will tell us how much current is flowing through the wire.
- Power pack- It is the power supply.
- Variable resistor- helps regulate the current and help stop the wire from burning.
- Wires (x6)- to connect everything together. Connects the voltmeter, ammeter, variable resistor, power pack and whichever wire on the ruler together.
- Crocodile clip- attaches to the end of a one of the six wires. Will then clip on to the wire that is being investigated and this will then show how much voltage and current there is flowing through that wire.
Labelled circuit diagram of apparatus
Step by step method
- Set the apparatus up on one of the workbenches, near a plug so you can connect the wires to it
- Record thickness of the wire
- Attach the crocodile clip to the wire at every 10, 25, 40, 55, 70, 90 cm of the wire
- Plot the results that you got for the voltage and current in a table and put the average.
- Repeat above using the other three wires
Safety precautions
We made sure we had our hair tied up when do the experiment in case our hair got caught in the wire and burned. We also did the same with our ties, tucking them under our jumpers in case they also come in contact with the wire.
We thought that this method was a much better way than in our preliminary experiment because in our first attempts, we measured at every 10 cm and only used one type of wire. This caused us to have unreliable results and not having a big difference in the numbers too. Using these new numbers to measure the wire with gave us a big difference in numbers in our results and made them more reliable. Furthermore, using copper, constantan, manganese and nickel chrome made a real difference in our results as we could see how the thickness of the wire affected the resistance.
We used four different lengths of wires:
- Copper
- Constantan
- Manganese
- Nickel chrome
We decided to do five repeats of each length of wire. This way, we can see how our results varied in each length of wire and how the thickness of the wire affected the resistance. This will also make our results more reliable. Another thing is when it comes to drawing out the graphs, we will have some varied and some not so varied results to plot on.
Variables
The measuring of the wires could affect the experiment we are carrying out as if we didn't measure the exact cm, the resistance could be different from the other repeats making the results more unreliable. The wires that connect everything together could affect the experiment as if it is all connected up wrong, the results won't be correct leading to unreliable results.
To control this factor, we will make sure we clip the crocodile clip on the exact cm we are using. Also we will check that all the wires are connected to each other correctly and will to a little test turn to make sure.
Results
Wire 1, Copper
Wire 2, Constantan
Wire 3, Manganese
Wire 4, Nickel chrome
Conclusion
Having performed all the experiments, the following conclusions were drawn:
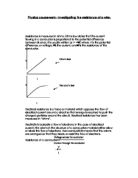
My graphs show positive correlation which shows as predicted, that an increase in length resulted in an increased resistance. This can be said for each wire tested.
All of the wires show a strong trend of a straight line. The length of the wire is shown to be directly proportional to the resistance, when doubling the length, the resistance doubles.
The overall resistance of the wires seemed to increase considerably. Due to the strong correlation of the results, the reason why this could be is the further along we measured, the higher the resistance. This is because when the wire is thin, there are lots of atoms for the electrical current to pass so there is a large resistance.
I believe that the answer to the original question is that the further up the wire you measure at, the higher the resistance is.
Evaluation
Generally speaking, wire 1, copper contains very accurate results due to the fact that all of the average resistance increases slowly. The only one that does not is the length at 90cm, which was where the resistance was much higher, at a resistance of 3.74. Also, wire 4, nickel chrome had three anomalies which were at 25, 70 and 90 cm. This could have been of a result of:
- The length of wire for that particular measurement was not correct. At these measurements, it could have been possible that it was longer than it should have been, causing a higher resistance. The solution to this is to measure the lengths more carefully and ensure that the wire is pulled tight against the metre rule and that the crocodile clip is secure.
- For a particular result, one or more of the connections could have been faulty, causing extra resistance at the connections. A solution to this would be to, before each experiment, connect the connections together without the wire in place and measure the resistance then. If it is higher than it should be then the connections could be cleaned.
Wire 2, constantan and wire 3, manganese, on the other hand, didn’t have any anomalies because the resistance increased at a steady rate and was at a suitable level.
I think my method worked quite well but if I could redo my method again, I would change it a little bit. I found that in our method we got much more results and for each length of wire, the measurements were closely the same. What I found was that for the wires nickel chrome and manganese, the average went very high by the time we got to 90 cm whereas the wires copper and constantan were quite low. So instead of measuring at 90 cm, we could have gone slightly lower down. We made sure our hair was tied up and our ties were tucked in throughout the experiments.
We don't need to improve our equipment list because the equipment alone itself worked quite effectively.
I think that my data is accurate and reliable because we did five repeats of each wire meaning that we get more results and data which will make us be able to outline any outliers and will help to prove my question that I am investigating.
Further data which could be collected to improve the reliability of my results are a bigger range of materials and lengths so this way we would get even more results and this would make everything even more reliable.