We also had to make sure that there was not a slight breeze that could have effected the rate the ball travelled down the slope, if there was a slight breeze this could speed the ball up or it could slow it down depending on which way the breeze was coming from. We made sure there was no breeze by shutting all the doors and windows and made sure there were no fans on in the room.
We also had to make sure that the table was completely level because if it wasn’t the apparatus wouldn’t be level either and this could have meant that the ramp was steeper than we wanted it to be therefore meaning that the ball would travel faster and visor verse. We used a spirit level to make sure that the table was totally level. We also had to make sure that the end of the launch ramp was totally level other wise the ball could have been launched at an angle and therefore it would have travelled further, we used a spirit level for this too.
Type of Ball:
We had the choice of three balls in our experiment. They were:
- Large steel ball.
- Medium steel ball.
- Marble.
We tested each ball and the results are in the table bellow.
KEY
Distance travelled by ball (cm)
Large steel ball:
- Most air resistance (caused the ball to move slowly down the ramp therefore effecting how far it would travel.)
- Heaviest (caused the ramp to dip as it travelled down it.)
- Shortest horizontal distance.
Medium steel ball:
- Less air resistance than large ball.
- Didn’t cause the ramp to dip and moved smoothly down the ramp.
- Made a very clear crater in the sand.
- Had the furthest horizontal distance.
Marble:
- Had the least air resistance
- However because it was very light it was slightly bouncy on its course down the ramp, which therefore meant the horizontal distance, would be un-accurate.
- The crater made by the marble was too small.
*We decided to use the Medium Steel ball, * because it had the best attributes o f all three balls. Therefore it gave the most accurate results.
We then tested the medium steel ball at several heights from 10cm to 90cm the height increased by intervals of 20cm. We repeated each launch height four times. This helped us to see how the height would affect the horizontal distance travelled and see if our results were repeatable. The following table shows our results:
Look at other results table for key.
During our preliminary experiment, we had to make sure:
- That the table was level; we did this by using a spirit level. If it was not flat, it could have made the ball travel further or not as far, depending on the degree of which the table was not level.
- That the launch ramp was parallel to the floor at the edge of the table; we did this by securing the launch ramp to the table with “Blu-tack.” Each time we made sure that 20cm of track was fixed down to the table to make sure our results stayed constant. If the ramp was not parallel to the floor, the ball would not travel as far and also our measurements would not be accurate. We also used a spirit level here to make sure that the ramp was level on the table because if it wasn’t flat on the table then the ball would have a greater angle of elevation and would therefore travel further.
-
That the height of the ramp was attached to the clamp stand at the same height (90cm) each time. We did this by measuring how high the clamp was on the clamp stand with a metre ruler. If it was not the same for every test, the results could have become inconstant
-
That the rulers were perpendicular to the table; we did this by using a setsquare, and checked the position of the rulers before each test.
- That the sand was smooth before the ball made the crater, otherwise, the measurements could be inaccurate because we could have not measured to the right crater.
- That there was no sand still on the ball. We did this by wiping the ball in a clean piece of material each time. We did this to stop the ball having any more friction than normal because if it did have the velocity it was travelling at would have changed and therefore the horizontal distance would have changed too.
Safety Precautions:
There were very few safety precautions that had to be taken. This experiment has a very low risk level because there is no chemicals being used and we were not heating anything. It is quite a straightforward experiment. The only real safety precaution was making sure that the equipment (the clamp stand and ramp) didn’t fall over. Also to make sure that the ball didn’t roll across the floor, we had someone there to catch it or at least stop it.
REAL INVESTIGATION:
Method:
Equipment:
-Table
-Plastic rail
-“Blu-tack”
-Boss-clamp
-Clamp stand
-2x Metre ruler
-Set square
-Wet sand in tray
-Medium steel ball
Setting up the practical
- Make sure the table is level using the spirit level; adjust the height of one or more of the legs of the table if it is not level.
- Set up the boss and clamp stand at one end of the table, with the plastics rail clamped to it making sure that it slopes downwards.
- Fix the other end of the rail to the table with “Blu-Tack” making sure the last 15cm is level with the tabletop.
- With a permanent marker, mark on the launch heights of the ball. To do this accurately, use the setsquare and metre ruler. Double check the heights before each launch as the equipment may move.
- Put the tray of damp sand on the floor near the table; the distance away from the table will change depending on the launch height.
- Using the metre ruler and a set square measure how far the ball has travelled from the base of the launch ramp.
- Repeat each step at least five times for each launch height to get accurate results.
In the final experiment we launched the medium steel ball from nine heights from 10cm to 90cm the height increased by intervals of 10cm. We marked on the launch ramp what each height was so that we could accurately line up the equipment each time. We repeated each launch height different times depending on the accuracy of the horizontal distance. We yet again measured the distance to the nearest ‘mm.’ We chose to have different outlier boundaries for each launch height depending on the number of tests run from each height. The outlier boundaries ranged from 3cm to 4cm.
One person would release the ball from the height on the ramp. Another would see where the ball had landed in the sand. This person placed the setsquare up against the ruler to make sure that the measurement was accurate. A third person would check the measurement and record each result in a table. Our results are in the table bellow:
Outliers are in Red.
Analysis:
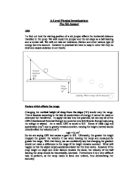
Graph One: A graph to show how changing the launch height of which you drop something affects how far the object travels. (Medium steel ball)
This graph shows that as the launch height is increased the distance travelled by the medium steel ball, increases. This a curve steeper at the beginning and less steep at the end.
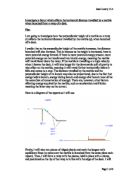
Graph Two: A graph showing average distance travelled (squared) by medium steel ball.
This graph shows that as the launch height is increased the distance travelled in centimetres squared increases too. This graph is a straight line which goes up in a proportional way. Showing a positive correlation between the launch height and the distance travelled squared.
How I Got A Straight Line:
The ball starts off with Gravitational Potential Energy (GPE) at the top of the track. Then this changes into Kinetic Energy (KE) at the bottom.
GPE = Height x Mass x Gravity
KE = Mass x Velocity ²
This means…
Height x Mass x Gravity = 0.5 x Mass x Velocity ²
So… Height x Gravity = 0.5 x Velocity ²
.’. we can say that height is proportional; to Velocity² as gravity is constant
Conclusion:
Overall I think that the experiment went quite well. Although we had to do a lot of tests in a short period of time which could have affected the reliability of out results. Our range bars are quite small and we did repeat each launch height a number of times so we can be confident that our results are reliable. However we did get some outlier results ion our results table that are not included in our graphs therefore we do need to question whether the experiment was 100% reliable. The outliers may have been caused because a sudden breeze may have come from a door opening if someone left the room, also we may have not quite cleared all the sand off the ball in one of the runs. Due to the fact that our experiment has limitations I would ideally like to re-do the experiment and maybe try a wider range of launch heights for example go up in intervals of 5cm rather than 10 also we could increase the number of times that we repeated each height. In a perfect situation to stop there from being any sand left on the ball we could have used a new ball each time we launched the ball. However this may cause more error because each ball may be slightly different. All in all the experiment was as accurate as it could have been in the conditions we had to work in. therefore it has given a good insight into how the launch height affects the distance travelled by a ski jumper. However it will not give a perfect simulation of it, as weather, air resistance, wait and all sorts of other things will affect how far the ski jumper travels.