Controlled -The volume of hydrochloric acid will be kept the same throughout the experiment because if it is changed it may affect my results. Also the concentration of the hydrochloric acid will be kept the same.
-The volume of sodium thiosulphate solution, I will change the concentration of the solution, but not the volume because this may affect my results.
-Temperature, I must keep the temperature the same because if it is hotter for one of the experiments then the particles will have more energy and the reaction will be faster.
-The person looking at the cross must be the same each time because some peoples eyes may be better than others. Also the distance of the eye from the flask must be the same each time because this may effect visibility.
Safety:
- Wear safety goggles at all times
- If any chemical is spilt wipe it up with a damp cloth and report it to an adult
Minimize the risks by working independently and in your own space, do not get too crowded.
Method:
- Gather all of the equipment and ensure that it is clean and ready for use.
-
Pour 5 cm3 of hydrochloric acid into a beaker
- Place the beaker on top of a paper cross
-
Pour 50cm3 of 4% sodium thiosulphate solution into the beaker
- Start the stopwatch
- Stir twice and leave
- Watch the solution until it turns opaque
- When you can no longer see the paper cross stop the stopwatch
- Record the time
- Repeat steps 2-9 with different concentrations of sodium thiosulphate solutions (3%, 2%, 1% and 0.5%)
Repeat this experiment 3 more times to check for anomalies
Making different concentrations
Fair Test:
I am going to make this a fair test by making sure that I use the same volumes of hydrochloric acid for each run.
I will make sure that all of my measurements are exact by placing the measuring cylinder on a flat surface at eye level when I am measuring out my chemicals.
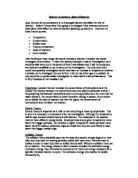
The Collision Theory:
The collision theory states that for a reaction to occur the reactant particles must collide with kinetic energy for the reaction to take place, but only some of the collisions that occur between reactant particles will react because some will not have enough kinetic energy to produce a reaction.
Reaction A Reaction B
HCl particle Na2S2O3 particle
As you can see, the chances of a successful collision taking place in reaction B, where the concentration of the reactants is greater, is more likely than in reaction A because there are more particles to collide with.
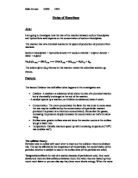
Prediction:
I predict that as the concentration of sodium thiosulphate increases the reaction time will decrease.
This is because the more concentrated the sodium thiosulphate solution is the more sodium thiosulphate particles there will be to react with the hydrochloric acid particles and therefore the more likely it is that a collision with enough energy will take place between a hydrochloric acid particle and a sodium thiosulphate particle in any given time.
Results:
These results show that as the concentration of sodium thiosulphate increases the reaction time decreases and therefore the rate of reaction increases.
I worked out the rate of reaction using this formula:
Rate of reaction = 1
Average time
Anomalies:
I think that the result 49.88 for the 1% concentration on the first run may be an error because it seems a lot lower than all of the other results for the 1% concentration. I think that the most likely reason that this result is perhaps not accurate is human error; the measurements could have been wrong when mixing the concentration of sodium thiosulphate or the stopwatch may have been stopped too early.
Sketch Graphs:
I am expecting my graphs to look something like this.
Graphs:
Average time taken for reaction
(hand drawn)
This graph shows that as the concentration of sodium thiosulphate increases the average reaction time decreases.
It shows that the average reaction time almost halves as the concentration of sodium thiosulphate doubles.
The Rate of Reaction:
(hand drawn)
This graph shows that as the concentration of sodium thiosulphate increases the rate of reaction also increases.
I have used a line of best fit to show this clearly.
Conclusion from my Graphs:
Both of my graphs do look how I predicted they would when I drew my sketch graphs.
The graphs showing the average time taken for each concentration of sodium thiosulphate backs up what I thought would happen in my prediction because if the average time taken for the reaction to take place decreases as the concentration of sodium thiosulphate increases it is reasonable to assume that the rate of reaction also increases.
The rate of reaction graph also backs up what I said would happen in my prediction, I thought that as the concentration of sodium thiosulphate solution increased so would the rate of reaction, my graphs show that this is correct.
Conclusion:
Overall I think that this experiment worked well. However I think that I could improve it next time by
- Using more concentrations of sodium thiosulphate, such as 1.5%, 2.5% and 3.5% as well as the concentrations that I used for this experiment.
This would mean that I would get more accurate results for the experiment.
- I would also create another graph showing each of the individual reaction times taken so that I could compare them and see how accurate my results were for each concentration.
I found that changing concentration affects the rate of reaction by increasing the rate of reaction if the concentration is increased, or decreasing the rate of reaction if the concentration is decreased.
This is what I predicted.