At a higher temperature, the number of collisions is greater because the particles are moving more quickly. When a collision occurs, there is more chance of a reaction-taking place because the movement energy in the particles is greater.
Catalyst
Catalysts increase the rate of reaction without being used up. They do this by lowering the activation energy needed. With a catalyst, more collisions result in a reaction, so the rate of reaction increases. A catalyst provides a surface on which the reaction can take place. This increases the number of collisions between the particles of the substances that are reacting.
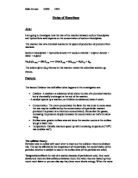
Aim: to investigate how different concentrations of hydrogen peroxide affect the rate of reaction.
Prediction: I predict that the higher the concentration of hydrogen peroxide, the faster the rate of reaction. I think this because to get a chemical reaction particles need to collide; this is called the collision theory. So a concentrated hydrogen peroxide will have more particles in the same volume. So the collisions of the particles will happen more frequently to increase the rate of reaction.
This is a prediction of how I believe a graph showing the amount of gas released at different concentrations would look like:
Apparatus:
Released
Fair test: I will have the same amount of catalyst in all of my five different concentrations of hydrogen peroxide. I will also have the same amount of time for my five concentrations of hydrogen peroxide.
Safety: I will use gloves when handling high concentrations of hydrogen peroxide. Also I will be wearing goggles at all times when handling hydrogen peroxide as high concentrations of it are very corrosive.
Accuracy and reliability: I will do the whole experiment minimum of three times. Also I will try my best to get the most accurate results. In addition, I will be using a burette, which will be a very accurate way of measuring the different concentrations of hydrogen peroxide.
Preliminary test:
In this preliminary test I will find out what is the best catalyst out of red lead and manganese dioxide powder. Also from this experiment I will be deciding what will be my time limit for each experiment and I will decide in grams the amount of catalyst to use. In this experiment I will set out all the apparatus as shown above. I will use 10V of hydrogen peroxide at 50 ml in the flask. Next I will add 1 gram of red lead to the hydrogen peroxide for 1 minute and measure the amount of oxygen released. Then I will do the same thing for manganese dioxide powder.
Preliminary test results:
Using this result I will be using manganese dioxide powder because it is a more effective catalyst then red lead. Also I will be using 0.05 grams of manganese dioxide powder rather then 1 gram because I believe that 1 gram was too much. I will be also changing the time to 30 seconds as believe that 1 minute was too long.
Method:
- First I will set out the experiment as shown in the apparatus.
- I will then use a burette to measure accurately the 5 different concentrations of hydrogen peroxide:
- 50 ml hydrogen peroxide
- 40 ml hydrogen peroxide and 10 ml water
- 30 ml hydrogen peroxide and 20 ml water
- 20 ml hydrogen peroxide and 30 ml water
- 10 ml hydrogen peroxide and 40 ml water
- Then I will pour the measured hydrogen peroxide into the flask where I will add 0.05 grams of manganese dioxide powder.
- Then I will quickly put the rubber bung on and start the stop watch.
- When 30 seconds is up I will record the amount of oxygen in the graduator tube.
- I will do this with all my concentrations and repeat this 3 times.
Results:
Test 1:
Test 2:
I have only done the experiment two times, as my two result tables are very similar so I believe that it would have been pointless do to it a third time. This is my average results, which I will use to make a graph.
Average Results:
Analysis of graph:
The graph shows me that as the concentration of the hydrogen peroxide increased so did the amount of gas released. This proves my prediction was correct as this means the higher the concentration, the higher the rate of reaction. The graph shows me that at the start of the experiment most gas was released, as the line is steepest at this point. The second point was slightly odd, as it did not follow the other points to join the line of best fit. The rest of the points were perfectly lined up showing that my results were very accurate. On my graph showing the results of experiment one and two and my average results it shows that the average results make a line of best fit right between the other two lines of best fit. This is why it is best to take the average results of more then one experiment to make your results more accurate.
Conclusion:
In conclusion, I believe that my prediction was right in that I believed that the higher the concentration of hydrogen peroxide, the faster the rate of reaction. I think this because by looking at my graph you can clearly see that as the concentration increased so did the amount of gas released. This is proven by the collision theory. For example if the is increased, there are more particles in the same volume. This means there is a greater chance of them colliding, so the rate of reaction increases. This is shown in the experiment that I carried out as it shows the higher the concentration the more oxygen released. In a low concentration, the number of collisions is low, so the rate of the reaction is slower. The concentration does not change the speed of the particles.
Evaluation:
I believe that my results are reliable. I think this because my two experiments have results that are of very similar values. This is one reason I did not do my experiment a third time. To increase accuracy I could do the experiment few more times and find the average of the results. Also I could have used a computer to draw my graph as it would be more accurate. I believe that my method is as reliable as it could have been with the time and equipment available. If I would have to comment on any anomalies, it would be for my second point on my graph. I think my results are still valid because I believe that it is a very tiny fluctuation in the graph, as it does not join all the other points on the line of best fit. This result could have occurred because of negligence. To increase accuracy I could do the experiment a few more times and find the average of the results. To make my experiment even more accurate and efficient I can also change the equipment I used. This will give me measurements that are more accurate. Some of the equipment that I could have used includes:
- Accurate scales that measures to more decimal places then the one I used
- Stop watch with alarm as the experiment may be stopped few seconds late
The reliability of evidence for my work is very valid and I believe it is sufficient to support my conclusion. The preliminary test gave me valuable information about the experiment as it helped me decide which of catalyst to use. Also it helped me decide on the amount of catalyst. If I were to do this experiment again I will have to have more than one person checking each measurement to make it as accurate as possible. I also can do the experiment a number of times resulting in results that are closer together. Then I would use only the concordant results to find the average, which would be more accurate. If I could take this investigation further it would be to investigate temperature and how if effects the rate of reaction. I could do this experiment by having a reaction happening at different temperatures and compare the rates of reaction.
Bibliography:
-
- Microsoft Encarta
-