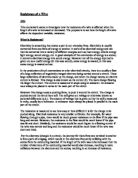
Diagram
.
I will start by taking measurements from 10cm of wire - the potential difference across it and the current flowing through it. This will allow me to calculate the resistance. I will repeat this two more times keeping everything constant. This will give me three results for the resistance in 10cms of wire. I will then calculate the average to give me the most accurate result.
I will then repeat the above experiment nine more times increasing the length of wire tested by 10cms each time. This will mean that after the last measurement has been taken I will have 10 different measurements for resistance along the length of 1m of wire.
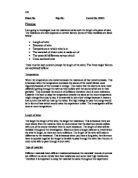
Safety
I will ensure that the circuit is broken when it is not in use. This way wire can not be left to heat up and then burn someone.
I will also guarantee that no sharp wires are poking out in places that people are likely to touch.
I will also ensure that they connecting wire are completely covered with the plastic coating to reduce the risk of shocks.
I will make certain all connections are secure.
Variables that could affect the investigation:
There are a few variables that could affect this investigation, including: the temperature of the wire, the length of the wire, the material that the wire consists of, the power of the cell pack and the cross-sectional area of the wire. These are all variables that could affect the outcome of this investigation.
The variable I am deciding to change:
The variable I am going to change is length. I am going to increase the length of the piece of wire being tested by 10cms each time I do the experiment.
The variable that will change as a result:
Resistance will change as a result of the length of wire changing. I predict that the longer the wire, the more resistance.
Variables I plan to keep the same:
I plan to keep the cross-sectional area and the material of the wire the same, to ensure that this happens I will use the same length of wire throughout the whole experiment.
I plan to keep the temperature of the wire constant. This is nearly impossible because the heat of the wire will increase as current flows through it. I will try to make sure that the wire cools between each reading.
I also plan to keep the power of the cell pack the same. If the cell pack power was not kept constant then the voltage would change, changing the current and resistance with it. This would effect my overall results. To prevent the power of the cell pack altering I will guarantee that the circuit will be broken when not in use, ensuring that the batteries do not wear down.
The range of measurements taken
I am going to be taking a large range of measurements. The wire being tested will be increased by 10cms each time the experiment is carried out until the wire is 1m long. This will give me 10 sets of results. When plotted on a graph the extensive range of results will allow me to give a more reliable prediction for what I think will happen next. This is also a sufficient amount of results to test the relationships between the variables.
How do I intend to get the most accurate results?
To obtain the most accurate results I will carry out each experiment three times and then take the average by adding them together and the dividing by three. Therefore I will only have one set of results.
I will also use two different types of measuring devices - Analogue meters (where you read the measurement yourself) and Digital meters (where the measurement is displayed automatically). This will ensure the reliability of my results as I will be able to compare the two readings. The digital meters are more accurate providing that the equipment is set up correctly. The analogue meters, although less accurate, provide readings which are compared those of the digital meters as a check that the digital meters have been correctly set up.
Results
In my results I noticed that, as the length of the wire increased, the potential difference reading increased. As I increased the length of the wire I notice that the current decreased. The differences between each reading gradually got smaller (by roughly the same amount as the potential difference) as I increased the length of wire.
As I increased the length of the wire the resistance also increased. It did so at a steady rate - increasing by roughly the same amount each time.
How accurate and reliable my results are: Austen obfuscated cky1988
I believe that my results are very reliable and accurate, to ensure this I undertook the following: W
I made sure that I took each reading three times and then took an average.
I used two different types of meters (analogue and digital)
I used a calculator to work out the resistance. Using the equation:
(Resistance = Voltage ÷ Current)
I kept the same cell pack through the whole investigation.
I ensured that I measured the length wire being tested against the wooden metre rule as accurately as possible.
I and two others carried out this experiment. Each of us had a given job (i.e. reading the measurement) meaning that we could complete each job as accurately as possible.
All of my results taken from the digital meter have been measured to the nearest tenth of a Volt/Amp. This will also increase the accuracy of my results.
How well my results support my hypothesis:
The hypothesis that I was testing was:
'As the length of a wire increases, the resistance increases'
My results support this as the resistance increased as I increased the length of the wire.
At 10cms the resistance was 0.36 Ohms
At 50cms the resistance was 1.19 Ohms
At 100cms the resistance was 2.22 Ohms
The above results prove my hypothesis
My further prediction that the resistance would be directly proportional to the length of the wire was partly correct.
At 10cms the resistance was 0.36 Ohms and at 20cms (double 10cms) the resistance was 0.58 Ohms which is almost double.
At 30cms the resistance was 0.79 and at 60cms (double 30cms) the resistance was 1.39 which is also almost double.
The above results partly support my further predictions. I believe that if I was using far more accurate equipment then my results would reinforce this prediction even more.
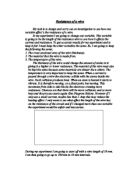
Conclusion
From the results on the 'graph showing resistance in relation to the length of a wire' I can see that the relationship between the length of a wire and resistance is almost linear (it goes up in a straight line on a graph). This makes sense as the wire is of unvarying thickness. The line is not perfectly straight, this could be due to the inaccurate measuring of the wire, or, more likely, the heating effect on the wire. 5h
In contrast to the resistance the relationship between voltage and current and the length of a wire is not linear. The reason for this is that the volume of the batteries is limited. Therefore (as shown on graph 2) the current and voltage will level to the capacity of the battery which curves the graph. Resistance can infinitely increase as long as it has the current and voltage to support it. The heating effect on the wire would obviously also affect the readings of voltage and current.
My results on graph 1 show that the length is not directly proportional to the resistance. After a great deal of research I have discovered that this cannot be so and that a length of nichrome wire should be directly proportional to the resistance in that wire. From this I am concluding that the heating effect in the wire, which was out of my regulation, must have made my results inaccurate. I believe with more 'up-to-date' technology that perfectly accurate results could have been achieved.
Evaluation
I feel that I planned this investigation very well as I took every factor that could effect the experiment into consideration. I believe that I took a sufficient number of readings to allow me to support my hypothesis and to draw a reasonable graph from.
I repeated each individual experiment three times. The results did not differ enormously from each other showing that they were probably all roughly correct. By then taking an average I got one result for each individual experiment. This was the best way of finding the most accurate result I could get.
My results do back up my conclusion well. I produced two graphs showing the resistance in one and the current and voltage in another. They presented information that was not as evident as in my results table such as the differences between each reading.
I feel that the equipment used in the investigation was reliable. I used two types of measuring devices to read voltage and current. The first used was digital meters, probably the more accurate of the two as it displays the reading for you. The second was analogue meters, slightly less accurate as you have to gage where the needle is on the screen. After comparing the two sets of results apart from being more accurate the digital meters results were roughly on a par with those of the analogue meters. This shows that the results have been read correctly and are as accurate as could be. If the result had been very diverse I would have re-taken the experiment to find out what was wrong. think if I was to do this experiment again I would use more up to date equipment to measure the voltage and current as this would give me far more accurate and reliable results and would support my hypothesis better than the results I obtained from the equipment I used in this investigation.
I could extend this investigation to test how the cross-sectional area of a wire effects the current in it. I would do this by collecting about five wires of different diameters and cut them all to the exact same length. I would measure the current through them and the potential difference across them and see how the resistance changed in each wire. I would predict that the resistance would decrease as the cross-sectional area of a wire increased.