A4c: Detailed Plan
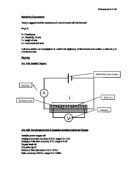
- confirm power supply unit is at 0v
- construct apparatus as illustrated in diagram
- connect voltmeter negative crocodile clip on 0.100m
- increase current to 0.30A
- take reading from voltmeter as quickly as possible for the wire to remain at the same
- switch off power when entering the reading into required data
- connect the voltmeter negative crocodile clip to increased 0.200m
- repeat process till I reach 1.000m
- repeat the whole process again but with 0.60A
- plot a graph of R vs. L which is required to be a straight line through the origin
- use the graph of R vs. L to find the value of R
- use value of R in the given formula to find the value of ρ
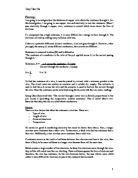
A6b, A6c: Number and Range of Readings and Logical Sequence
I will measure a reading from 0.100m up to 1.000m in steps of 0.100m, 0.200m, 0.300m… 0.900, 1.000. This method will give me 10 equally divided readings of p.d.
I will repeat this procedure with 2 different currents, 0.30A and 0.60A.
A8a: Reason for Procedures
- switching off power supply will reduce any alteration in resistance since leaving the power on may result in heating the wire
- 10 evenly spaced in length between 0.100m and 1.000m will give me an accurate graph and simple to draw a best fit straight line which should go through the origin
- Repeating this experiment twice with two different currents should give me two similar readings so I could find a good average to find the Resistivity of the wire
A8b: Justification of Design
The maximum current I will be using during this experiment is 0.60A and the peak resistance of the wire at 1.000m is 6.67Ω therefore by using the formula,
V max = I max R max = 6.67max x 0.6max = 4.00Vmax
Hence I require of a voltmeter ranging 0 to 5V. Therefore the maximum heat per second produced is given by
P max= I 2 max R max = 0.60 2 max x 6.67max = 2.40 W max
Which is a very low power rating, this quality should sustain a constant temperature of the resistor.
Implementation
B6d, D2a: Sources of Significant Error
I expected a problem with crocodile clip connection and wires they took up extra area of the wire causing inaccuracies in measurement
B8a, D2c: Actions Performed to Minimise Errors
- Ammeter and Voltmeters with appropriate ranges (0 to 1.00A,0 to 5.0V)
- Low current to minimise heating the wire(0.30A,0.60A)
- Turning off the power supply between readings to corroborate a constant temperature
Arranging Evidence
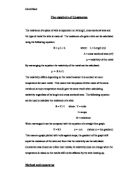
C8a: Statement of established theory
The graph should be a straight line through the origin where resistance(R) is proportional to length (m).
The gradient R = ρ / A x L therefore ρ and A are constants similar to the to the line formula, y = m x,
ρ = (gradient x π d 2) / 4
C8b: the graph of R / Ω against L/m, is a straight line through the origin. R is directly proportional to L
C8c: Gradient = ΔR / ΔL = 6.67Ω / 1.000m= 6.67
Thus using the rearranged formula above (C8a) the value of ρ can be established:
ρ = (gradient x π d 2) / 4 = 6.67 x π x (1.09 x 10⁻⁶)2 = 1.09 x 10⁻⁶ Ωm
Results
D2c: as you can see the value for R is the same for each length so the average value of R remains the same.
*graph attached
Evaluating Evidence
D2b: Anomalies in Experimental Data
My graph is good straight line with no scatter or any anomalous points.
D2d: Discrepancies of Expected Data
The actual value of for ρ is 1.08 x 10⁻⁶ Ωm my value ρ gave of 1.09 x 10⁻⁶ Ωm which was close.
D4b: Errors
Measurement (crocodile clips)
Δ m / m = 0.004m / 1.000m x 100% = ± 4.00 %
Current
Δ I / I = 0.01A / 0.45A x 100% = ± 2.2%
P.d
Δ V / V = 0.1V / 3.0V x 100% = ± 3.333%
Resistance
Error in resistance = V / I = 2.2 + 3.33= ± 5.53%
Resistivity
Error in resistivity (ρ) = 5.53 + 0.1 =± 5.63%
D4a: the most significant error is voltage however this affected the value of R which led to in accuracy in my final findings of ρ a ±1.1% inaccuracy of the actual value of ρ
D4c: Reliability of Techniques
- Ammeter and Voltmeters with appropriate ranges (0 to 1.0A,0 to 5V) for accurate readings
- Low current to minimise heating the wire(0.30A,0.60A) and maintain a constant temperature so that V / I = R will give precise values for resistance
- Turning off the power supply between readings to corroborate a constant temperature again, so that V / I = R will give precise values for resistance
These point proved by my value of ρ was close to the true value and my graph is a good straight line through the origin.
D4d: Reliability of Conclusion
Actual value of ρ = 1.08 x 10⁻⁶ Ωm
My value of ρ = 1.09 x 10⁻⁶ Ωm
As a result Δρ= 0.01 x 10⁻⁶ Ωm
% error in ρ = 0.01 x 10⁻⁶ / 1.08 x 10-6 x 100% = 0.93% this is an insignificant difference. My conclusion is legitimate as my graph is a straight line through the origin, I have also found that L is an independent variable and R is dependant on L. As a result, when length is increased, the resistance also increases. In addition my value for ρ is in close proximity to the true value of ρ and my prediction agreed with my results. In addition I finally conclude that the formula is genuine and works
D6a: Sources of Systematic Errors
I have no systematic error as you can see my line goes straight through the origin
D6d: Proposals for Improvement
- Point contacts as a replacement for crocodile clip connections to increase accuracy to length (L)
- Use digital meters in replacement for analogue meters to find more accurate values for voltage and current resulting in a exact value of resistance
- Extend length of wire and assess if the resistivity of the wire behaves the same
- Record voltage every 0.05m up to the max length of the wire
- Switch off power supply longer to ensure a consistent temperature
- Extend my investigation to wires made of different metal alloy wires