This experiment was repeated with all the different thickness for copper and constantan wires. As we are using weights and the wires could snap at any time it is important to take into considerations the safety aspects. In case the wire does snap goggles should be worn and also a trap of sand should be place underneath the weights so that if the weights do fall they fall into the tray of sand instead of on our toes or on the floor.
Fair Test
To make the experiment as fair and accurate as possible only one variable should be used. The variables in this experiment: -
-Thickness of wire: the thicker the wire the more force needed to extend the wire and vice versa
-Temperature: the temperature affects the wire as if the wire is warm it will extend further where as a colder wire will not make the same extension and is likely to snap quicker than a warm wire.
-Load: the more weights that are added to the wire the more extension that occurs
In the experiment I am testing how much the wire extends by varying the weights, but I am also changing the thickness of the wire. To make it a fair test I changed one variable at a time.
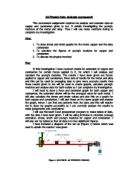
To make the experiment accurate I am using searles apparatus. This is where the scale for measuring extensions is on the reference wire. If the test wire extends as weights are being added to it the scale moves with it therefore measuring the extension. The extension of the wire is measured using a vernier scale and this is used to measure tiny extensions accurately and is accurate to 0.1mm. If the temperature changes and makes the test wire expand or contract the reference wire changes in the same way. The constantan and copper wires diameters can be measured using a micrometer screw gauge. This is accurate to 0.001mm.
Analysis
Graph 1: This line graph of stress & strain for copper after a load of 1.96N shows that after a load of 1.96N the plastic limit hasn’t been reached, this region is the point where the material no longer returns to its original shape once the force is removed. This means that if the force of 1.96N were to be removed the copper wire would return to its original length of 1m. The reason that the wire can return back to its original length is because the no dislocations in the ploystalline structure have occurred. Also after a load of 3.92N (graph 2) and 5.88N (graph 3) the plastic region hasn’t been reached. As the plastic limit hasn’t been reached it shows that Hooke’s law can be applied, this is where stress and strain are proportional to each other.
Graph 4 & 5: These line graphs of stress & strain for copper after a load of 7.84N & 9.8N shows both the elastic (above his point Hooke’s law can no longer be applied) and a plastic region. We can tell that the elastic limit of the copper wire was at 81MP on both graphs, this is found from reading of the graph where the straight line ends and the curve begins to start. This also shows the yield stress for copper. The yield point is a point just after the elastic limit this is where there is a big change in the material and this is due to a distorting force. The bonds between molecular layers break and layers flow over each other. After this point the material starts to become plastic, as it has reached and exceeded its elastic limit. The reason that the material can no longer move back to its original shape once the force is lifter is due to dislocations in the polycrystalline structure of the metal moving, the dislocations move along by a process called slip. All the atoms are in a crystalline arrangement and during the elastic area they are stretched and elongated until they reach their elastic limit when they will begin to slip against each other and permanently deform. As the wire extends the crystalline structure stretches and begins to dislocate and the dislocations slip until the structure is perfect and there are no dislocations left.
The young’s modulus of copper can be seen in table 7. It would have been expected to find the young’s modulus of the copper wire of different wires to be the same however looking at the table it can be seen that it does not. This therefore shows some errors in the experiment. By taking an average of the results the I have found the young’s modulus of copper to be 20917.09 Mpa.
Graph 6, 7 & 8: This line graph of stress & strain for constantan after a load of 1.96N, 3.92N & 5.88N shows that after a load of 1.96N, 3.92N and 5.88N the plastic limit hasn’t been reached. As the plastic limit hasn’t been reached it shows that Hooke’s law can be applied, this is where stress and strain are proportional to each other.
Graph 9 & 10: This line graph of stress & strain for constantan after a load of 7.84N & 9.8N like graph 1 shows both the elastic and a plastic region We can tell that the elastic limit of the constantan wire was at 85MP, this is found from reading of the graph where the straight line ends and the curve begins to start. This also shows the yield stress for constantan.
The young’s modulus of constantan can be seen in table 14. The young’s modulus has been calculated for each wire separately, the reason for this is because in theory the young’s modulus for copper whatever the diameter of the wire should be the same, however looking at the table it can be seen that the youngs’ modulus is not the same throughout the table. Looking at part of the table: -
Taking an average of the young’s modulus for constantan we get 30012.63 Mpa.
Looking at the graphs and the elastic limit and young’s modulus of the two wires it can be seen that they are quite similar. This is to be expected, as constantan is an alloy, which usually mainly consists of about 60% copper, this would therefore mean that it would have similar properties. It will not have the same properties as copper as it is also usually contains 40% nickel, it would then also have some of nickel properties. Also as mentioned above the young’s modulus of a metal doesn’t really change much with alloying. By comparing the two graphs it can be seen that constantan has a steeper graph and the steeper the graph to stiffer the material, therefore constantan is slightly stiffer that copper. Also by looking at the young’s modulus that has been worked out it can be seen that constantan has a bigger young’s modulus then copper. In physics “modulus” means a measure of the extent that a substance processes some property. Young’s modulus describes how well an abject retains its length when stretched or compressed. It is also a measure of stiffness. Therefore as copper has the smaller value of young’s modulus it means that copper is more easily stretched then constantan, since less stress is needed to achieve a given strain.
On the graphs I have included error bars. The reason that I have included error bars is because the metre ruler has an error of 0.1mm and also an error of 0.01mm on the veriner scale and the micrometer screw gauge. These bars then take this error into account.
Looking at the graphs it can be seen that there are some anomalies this could have been due to many factors. Errors that could have taken place include the errors in the equipment and the other random systematic errors that can occur. Also there could have been parallax errors (this is an error which occurs when the eye is not placed directly opposite a scale which a reading is being taken), reading errors this is when errors come about when guess works is involved in taking a reading from a scale when the reading lies between the lines.
Another error could have been creep; this is where the wire is stretching when no more weights have been added. As the wire is stretched the diameter of the wire decreases and before the wire snaps plastic deformation takes place. This reason this happens is because metals such as copper and constantan are ductile and they can have large plastic deformations without fracturing. It happens because atoms move as the plastic deformation in the crystal structure move to a place of lower stress. This causes the wire to become thinner as the atoms are moving away from the stress part. The stress then increases because the cross-sectional area has decreased. This increases the ductile flow and so the metal yields and gets thinner and thinner. Once plastic deformation starts, atoms will continue to flow without any increase in stress. .
Another cause for inaccuracies may be due to the fact that the 1m length of test wire may not have been accurately measured out. As the vernier scale measures in mms, but the test wire was measured out using a metre ruler and this is not accurate to 1mm.
Improvements that could be made to the experiment would be use a longer test wire as it would be easier to measure the strain, for example, if we used a sample ten metres long we would have a ten times better resolution, making our results much more accurate. We would then need to ensure that the weight of the 10M wire was very much smaller that the weight we added to induce strain.
Also to further improve the experiment I would test more different diameter of wire as the there is a gaps in-between the points on the graph where we had to predict what would happen there it would be more accurate to test more wires with different diameters in-between the points. I would also add weights at smaller intervals instead of 200g jumps, this would help in making the graphs more accurate, therefore allowing us to read of the graph more accurately getting better readings.
Aspects of the experiment that were good were, the vernier scale is sensitive and the maximum extension, which could be read off it, was dependant on how much force is applied. This method is much more accurate than the clamp and pulley method which could have been used. The experiment was done in the same classroom and was done at room temperature as the temperature of the wire reduced the accuracy of the results as the wire stretches more under warm conditions because the wire is less stiff then if it was in cold temperatures.