Planning:
In this investigation a simple circuit will be set up to read the voltage and the current when the length of wire changes. The length will range from 10cm - 100cm (1m) with intervals of lOcms. The length of the wire will be changed by moving the crocodile clip across the wire on the ruler.
We did preliminary tests to ensure that the wire did not get to hot, and how many cells to use in the circuit. The number of cells I used was important, as it would determine how hot the wire got. If the wire got to hot, energy would be given out, as heat and the resistance would be increased.
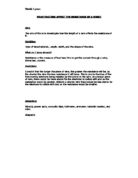
The circuit should be set up as in the circuit diagram below. It is important that the voltmeter is set up in a parallel circuit and the ammeter in a series. The readings from the ammeter and the voltmeter will be used to work out the resistance. This can be done by using the formula below-
V=IR
WHERE V = VOLTASE, I = CURRENT AND R = RESISTANCE
This meant that I could find and record the resistance.
Also in my test I will need certain equipment:
I started the experiment by cellotaping the Nichrome Wire (over 1 meter long) to the meter ruler. Then the ammeter was switched on which was connected to the Nichrome wire via the crocodile clips. The resistance was then recorded down for various lengths ranging from 0 to 100cm. I then plotted these results on a graph.
To collect the data for my graph I had chosen to take a range of 10 lengths. I had chosen a range of 10 as to plot an accurate graph I will need at least 10 points to
mark on the graph. The lengths that I had chosen were as follows: 10cm, 20cm, 30cm, 40 cm, 50cm, 60cm, 70cm, 80cm, 90cm, and 100cm. I have chosen these lengths
because they are easily measured by the meter ruler and give a good range of results. Voltage is not used in this experiment as it will heat up the wire and that will affect the results. I will repeat my results twice.
Fair Test:
To ensure that the investigation is carried out in a fair way ad that the results will be accurate and reliable, a number of things must be followed. The only variable in the test will be the length of the wire. The wire must be pulled tight against the ruler and taped in pace to ensure the length is accurately measured. The same circuit and battery must be used
throughout as different batteries may have different voltages depending on how old they are. The test should be repeated three times and an average must be taken to ensure that the results are a reliable source.
Obtaining Evidence:
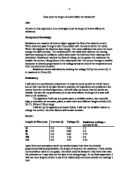
My procedure was appropriate because I gathered a wide range of evidence, which was reliable, with no anomalous results. I took ten readings ranging from 100cm of wire to 10cm of wire, 10cm, 20cm, 30cm, 40cm, 50cm, 60cm, 70cm, 80cm, 90cm, and 100cm. The longer the wire the greater the resistence was. To be accurate I repeated the tests three times at each length and then I took an average of the three lengths.
Analysis:
The results from the graph give a clear indication of how the resistance compares to the wire length. There is a very strong positive correlation. This means that when the length of the wire increases, the resistance also increases. The results are also directly proportional, meaning that when one doubles so does the other. In a piece of nichrome wire, there are a number of atoms and free moving electrons. Electricity is the movement of these electrons through the wire. Resistance is caused when the free electrons moving through the wire collide with the atom s making their path through the wire more difficult. This means that if here are more
atoms in the way to collide with the free electrons and so the resistence is increased. In a length of wire there are a number of atoms. In turn this will lead to there being double the number of collisions between the electrons and the atoms increasing the resistance by two. This explains why the results were directly proportional. For example a wire that was 10cm long may have 5 atoms blocking the electrons. Therefore in a wire 20cm long there would be 10 atoms meaning that the resistance had doubled.
The results that I have obtained support my original prediction. This is because in the prediction I said that as the wire length increased, the resistance should go greater. I also said that the link should be directly proportional. The results have shown that this is true.
The line of best fit clearly shows that the results followed the expected pattern very well. The points are very close if not touching the line. This shows how the results were directly proportional throughout, as the gradient remained the same.
Evaluation:
From my graph I can see that my results that I collected are very reliable. I know this because my graph does not show any individual anomalous results. I can see on the graph that none of the results plotted are anomalous because all the points lie along the line of best fit.
When I was measuring the lengths of the Nichrome wire, my measurements might have been slightly inaccurate as the rulers used might not have been exact, and it was difficult to get an accurate reading of length by eye, as the wire was not completely straight, so it may have been of different thicknesses throughout the
length. This would have contributed as a slight error in my results. As this factor probably only made a slight difference, it did not affect my results.
The crocodile clips and the connecting leads could have affected the fairness of the experiment. They are a different type of metal from the Nichrome wire and
may have different properties and therefore different resistance. Therefore the resistance of the Nichrome wire showed up on the ammeter was slightly more than it actually was. To solve this problem, I would have found out the resistance of the connecting leads and crocodile clips before each experiment and minus it from the overall resistance of the Nichrome wire plus the connecting leads plus the crocodile clips.
c = a - b
a = overall resistance of Nichrome wire, crocodile clips and connecting leads
b = overall resistance of crocodile clips and connecting leads
c = resistance of Nichrome wire
results with formulas from textbooks it proves my results are accurate enough to support a firm conclusion that resistance is proportional to the length of the wire.
To make my experiment more accurate I could have got 5 sets of results and found an average between all 5 of them, but that would be too time consuming. I
don't think I could improve the experiment because it worked very well and got me some accurate results but I could use different thickness' of wire, different materials of wire or use a variable resistor. I also found the experiment quite easy to set up as well. A further experiment I could do would be to see whether the diameter of a wire effects the resistance. This would be very good because it is similar to the experiment I have done. The way I got my results were fair, I controlled temperature, voltage, length of wire, and the resistance in the circuit. Overall I feel that my test went well and I came out with a good se of results.