Limiting Factors- Light, carbon dioxide, temperature, and chlorophyll are all limiting factors, meaning that even when there is surplus of every other variable, the rate of photosynthesis will be limited by the limiting factor until there is an optimal amount of the limiting factor to increase the rate of photosynthesis further. Otherwise, the rate of photosynthesis can no longer increase.
Prediction: I predict that increasing the light intensity and by adding NaHCO3 will increase the rate of photosynthesis and this will produced O2, the more NaHCO3 will also affect
Hypothesis: When chlorophyll absorbs light energy, the light energy cannot be immediately used for energy conversion. Instead the light energy is transferred to a special protein environment where energy conversion occurs. This happens by using the energy of a photon to transfer electrons from a chlorophyll pigment to the next. When enough light energy has been harnessed at a reaction centre, ATP can be synthesized from ADP. During this reaction, oxygen is produced as a by-product and it is the oxygen bubbles that are being measured in the experiment. The greater the light intensity, the more light energy that can be transferred and harnessed to fuel reaction in photosynthesis.
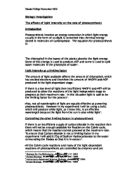
Diagram Of Apparatus
Method:
1. Set up the apparatus as shown in the diagram above but leave out the water, NaHCO3 and pond weed.
2. Fill the glass bowl with 850ml of water and 17g of NaHCO3.
3. Select 1 piece of pond weed roughly 5-10 cm long and put the stems in the narrow part of the funnel.
4. Place the pond weed in the beaker and secure the funnel upside down over (on top of) the pond weed using the plasticine.
5. Place a water-filled test tube upside down and over the funnel (see diagram).
6. Place the ruler so that the "0" measurement is aligned with the side of the beaker. (distance measured from side of beaker to edge of light bulb)
7.) Place the lamp directly in front of the plant so that it is 5 cm away from the beaker.
8.) With the light shining on the plant, record the number of bubbles emitted in a 5 minute duration
9.) Take 3 readings at the current distance and move the lamp 5 cm further away from the plant.
10.) Repeat steps 8 and 9 until 3 readings from at least 5 intervals of 5 cm have been taken, (up to 25cm)
11.) Proceed to the data analysis stage.
Results:
Conclusion:
From the results that I have gathered I can state that an increase in light intensity certainly does increase the rate of photosynthesis. But decreases after 10cm. From the graph there is a best-fit curved line. This means that the rate of photosynthesis increases at an exponential rate. But then decreases.
When measuring light intensity in terms of distance, the greater the distance, the slower the rate of photosynthesis. The decreasing part in the would eventually reach "0" but the light intensity is increasing in this part so why does the number of bubbles?
The shallowing of the line in the graph is due to other factors limiting the rate of photosynthesis. These other factors do not immediately limit the rate of photosynthesis but rather gradually. As light intensity increases the photosynthetic rate is being limited by certain factors such as carbon dioxide and temperature. As light intensity increases further, these factors limit the rate of photosynthesis even more until photosynthesis is completely limited and the graphed line become downwards.
Evaluation:
Overall, I would state the experiment as a success since my predictions were supported by my results. This is important in reflecting success only if my prediction was sensible and logical. Just as important is where the experiment was not a success and why. This photosynthesis investigation was probably not performed as accurately as it could have been due to some controllable and uncontrollable conditions. Some mistakes can be corrected.
While performing the experiment, the piece of pond weed did not photosynthesise at a steady rate, even when the distance from the plant to the light source was kept a constant.
A large factor in determining data accuracy is the amount of human error during experiments. The rate at which oxygen bubbles were being produced by my plant was so high that I found it difficult to count the amount of bubbles. I estimate a margin of error of at least 5 bubbles for some readings. To improve the accuracy of the results, the readings would have to be taken several more times. The entire experiment could have been performed again, and the new results could be combined if the same plant is used. But the photosynthetic rate of the same piece of pond weed would eventually decrease over time anyway. Repetitions would, however, improve the overall reliability of the results.
There are quite a few factors that could affect the results of my experiment. Some of these are variables that were mentioned earlier and could not be controlled, or they were variables that were not initially considered.
While performing the experiment, some of the oxygen produced from photosynthesis may have dissolved into the water. Some oxygen may have even been used by micro-organisms living on the pond weed. The amount of oxygen dissolved or used by microbes is probably insignificant to my results since the degree of accuracy at which I measured was not high enough. Some oxygen is also used during the respiration of the plant. But since only bubbles were counted, the volume of bubbles was not as important. But to volume of oxygen produced is important, since it was volume in terms of bubbles that were measured. As the rate of photosynthesis decreased due to a decrease in light intensity, the size of the bubbles produced also became smaller. This change in bubble size was no accounted for when the results were analyzed.
For a more accurate analysis of the collected data, volume should have been measured instead of bubble quantity since the size of bubbles can vary. Using a capillary tube in place of the test tube so that the volume of each bubble could have been measured could have done this.
During the high intensities I had experienced counting difficulties of the bubbles being produced. There are also factors affecting accuracy at low light intensities. With low light intensity, the pond weed receives some light energy from background light such as sunlight seeping through curtains or the light from the lamp of another student's experiment. To eliminate most all background light, the experiment must be performed in a completely dark room. Even then, some of the light from the lamp in my experiment would reflect of the table and reach the plant though this amount of light is probably insignificant in affecting the rate of photosynthesis.
The method of the experiment could probably also be improved to obtain more reliable results. As already mentioned, the capillary tube should be used in place of a test tube to accurately measure the volume of the oxygen produced. Due to the high rates of photosynthesis of the pond weed, readings should be taken within shorter time periods. I had originally chosen to count the number of bubbles in five minutes but this produced miscounts in the readings. If during a repeated experiment, counting bubbles is still used, there is a smaller chance for human error when counting within a smaller time frame. If the capillary tube option was to be chosen, volume should be measured for a smaller time frame to reduce the overall time to complete the experiment. Also, during high rates of photosynthesis, it would still be difficult and impractical to measure the volume of oxygen produced for a long duration.
Due to the nature and convenience of the experiment, it could be easily modified to investigate another variable of photosynthesis. Since sodium hydrogen carbonate (NaHCO3) is used to provide the pond weed with carbon dioxide. The amount of CO2 could be varied by performing the experiment with different volumes of NaHCO3. The plant would be kept at a constant distance from the lamp and a constant volume of water would be added to the sodium hydrogen carbonate. Another experiment using almost identical apparatus would be to vary the colour of the light the plant absorbs. This could be varied by using translucent colour filters in front the lamps. Since light wave length has already been identified as a variable of photosynthesis, it would be interesting to actually test it. The only problem of this experiment is that there is no way to define or "measure" the colour of light. Wave length would be a solution but this cannot be measured with available equipment. We only have a general idea of how to class colours. Because of this, the coloured light experiment should not be taken as seriously as light intensity or carbon dioxide.