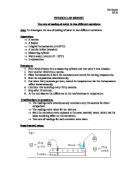
RESULTS & GRAPH for the investigation of the Cooling Rate of Water
RESULTS
Temperature(ºC)
RAW-expt1,2(Processed-average)
Volume of Water
Suface Area/Volume(higher or lower than previous)
Start Temp
End Temp
Drop in Temp
Time Taken(mins)
Cooling Rate(ºC/s)
0
53
37,38(37.5)
6,15(15.5)
5
3.1
5
Lower
53
41,42(41.5)
2,11(11.5)
5
2.3
20
Lower
53
40,38(39)
3,11(12)
5
2.4
25
Lower
53
46,46(46)
7,7(7)
5
.4
30
Lower
53
46,48(47)
7,5(6)
5
.2
35
Lower
53
47,48(47.5)
6,5(5.5)
5
.1
40
Lower
53
47,49(48)
6,4(5)
5
ANALYSIS & EVALUATION
Analysis
From the results and graph it can be seen that as the volume of the water increases the drop in temperature decreases in 5mins so the cooling rate decreases. The graph is showing a line decreasing and at a decreasing rate, as it starts off quickly decreasing then slowing down. As shown by the line not being straight it isn't linear graph, and neither is it linear. This supports my prediction of the volume increasing while the cooling rate decreases, and I think this because there are more particles in more volume so it will take longer for more particles to lose heat than less particles. And hen this heat is given to the environment as the environment is colder so it will do from the hottest destination to the coldest. The particles lose heat because when they are hot they get energy and speed up which then uses up their heat energy and they slow down and loss their heat. Also the volume increases faster then the surface area of the open top of the water in the surface area: volume, as, the volume increases faster than the surface area as the volume is increasing. And through this there are more particles but also more distance for this heat to travel, where it breaks bonds, so takes longer and has a lower cooling rate.
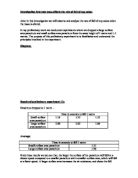