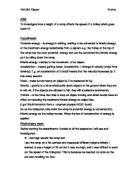
pe= mgh
pe= k x h
pe x h
pe is equal to ke
ke= ½ mv^2
ke= kv^2
ke x v^2
h x v^2
The equations shown above prove that kinetic energy will increase or decrease with the potential energy. But it also that once the ramp has reached its critical angle, the rule h x v will no longer work.
Equipment: A ramp longer than 1.5 metres
A metre ruler
A stop clock
A car trolley
Six blocks with a height of 10cm
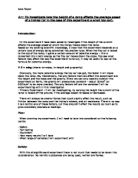
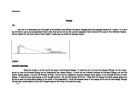
Diagram:
Trolley
Stop Clock
Ramp
Metre ruler
6 Blocks
Method: We need to find out the different times, it takes a trolley, to travel a length of 1.5 metres, from different heights. So I started off by marking the length on to the ramp using the ruler. They were our starting and stopping points. Then we stacked all six of the blocks. We placed the ramp on top of the blocks. We put the car trolley on top of the ramp, as it was time to start the practical. My group and I decided, that the best way to measure the time, was to record the points when the back of the car trolley, went over our lines. We measured the speed of the trolley, with the height being 60cm three times; this was to make our average results more accurate. We then did the same thing, for a height of 50cm, then 40cm and so on. We recorded all our results in tables and graphs.
Fair Test: We did as many things as possible to make our investigation fair. Such as:
- We made sure that the line where we first start to record the speed was in the same place on the blocks each time.
- We did each result 3 times, so we could make our results as fair and accurate as possible, for the time and facilities we were given.
- The same person did the timings on the stop clock, so the reaction time would be as close to each other a possible.
- We didn’t give the trolley a push off.
Safety: We made sure we handled the ramp and car trolley carefully.
Results:
Height and potential energy results table.
Conclusion: From my results, I have concluded that what I predicted was right and that the kinetic energy inside the car trolley is affected by the height of the ramp. It is only the height that affects the speed, since the mass and the gravitational pull stay constant. How I know it’s been affected, is because the times got slower as the height decreased. If you look at my results, you’ll be able to see the exact timings. My results also prove that what I said about critical points and how the rule h x v doesn’t work any more.
The speed squared showed and can be used to measure the potential energy of a car trolley.
Evaluation: Well there were many things that could have been improved. Maybe we should have started to look at longer length ramps and see if distance also has an affect on speed. Plus with a longer ramp, we could have looked at more heights.
One of our problems, which didn’t make our investigation very fair, was the human reaction time. It takes a human being on average 0.7 seconds to react. So the person recording timings wouldn’t be able to record accurately. Plus reaction times are also affected by our body’s conditions, such as being tired or unwell.
The reaction times could have been accurate if we had used light gates, as they would record the exact times when the car trolley would pass the points. The problem we had with light gates was that our school wouldn’t be able to afford them.