I have chosen to investigate the resistance of a wire because it will give continuous data which will be easily plotted onto a graph.
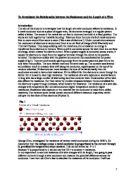
Diagram
Method
- Set up circuit as shown.
- R=V/I (where R=resistance in , V=voltage and I= current). I utilised the voltmeter and ammeter in because to find resistance you need the voltage and current.
- The variable resistor is utilised to allow me to vary the resistance so I can have more control over the circuit, so the wire will not over heat and ruin the results.
- Wire will be taped to a meter ruler, crocodile clips will then be slid up and down the wire to change the length. I will have 9 different readings, starting at 20cm and going to 100cm with 10cm intervals. Readings will be taken and resistance calcuated. At each different length of wire I will record 3 sets of results, each of different resistance on the variable resistor. From all the calcuated resistances I will find the average for that length.
Prediction
When the wire is at its longest there will be more resistance because the electrons have a longer distance of the wire to travel through and a harder route, and when it is shortest there will be least resistance, as the electrons have less of the wire to travel through. I predict that the results will be continuous. Because R=V/I, R must be proportionate to the length, because of this I predict there will be a straight line through the graph. The results will be continuous. I know this from preliminary work, which I did.
Results Table
Length Voltage (V) Current (I) Resistance Average
1 2 3 1 2 3 1 2 3
20cm
30cm
40cm
50cm
60cm
70cm
80cm
90cm
100cm
Analyzing
The evidence I have obtained during this experiment shows me that my prediction was correct: the longer the wire, the more resistance there is.
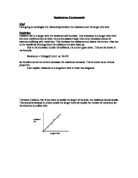
The evidence I have obtained is consistent and can therefore be easily plotted onto a graph. From the graph I worked out the gradient = 1.21/100 = 0.12 /cm. (see more working out on graph).
From the graph I can draw the conclusion that my prediction was right in saying that R is proportionate to the length of the wire. This is because of the formula R=V/I which means that the resistance=voltage/current. The volts increase because they depend on the lab pack and the position of the variable resistor in the circuit.
Evaluation
The procedure which I used was chosen to give as acurate results as possible, and this paid off as there were no obvious anomalies. Even though, I still think that there were some things which could have been improved on.
At the start of the experiment I had to change from using an voltmeter to using a digital one because the readings were too small to read accurately from the analogue one. In the end it worked out that using the digital voltmeter would produce more accurate results. I continued to use an analogue ammeter to keep the results accurate. Throughout the whole experiment I kept the same voltmeter and ammeter just in case there was a slight error on either one, there would be an error on all the results and I would not have anomalies.
At the beginning of the experiment I had to remove the sello-tape which was keeping the wire attached to the ruler because it was heating up very quickly and would have become dangerous.
I think that the results could not be entirely accurate because the wire would have un-doubtebly heated up during the experiment, which consequently would make the atoms inside it vibrate more which would increase the resistance.
Further work I could do would be to investigate the relationship between different materials and the resistance. To do this I could do the same experiment as I did before, but as well as increasing the length of the wire I would also investigate different materials.