Finding the Formula of Magnesium Oxide
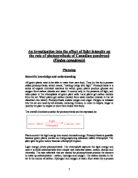
Finding the Formula of Magnesium Oxide Prediction I predict that the more magnesium burned the more magnesium oxide will be formed. Analysis I can see a pattern in my results. The pattern is a strong positive correlation. The reason for the pattern is that the more magnesium burned, the more magnesium oxide is formed. This is a fixed ration, if the amount of magnesium burned doubles the so will the amount of Magnesium Oxide. For example, in the graph Magnesium of the mass 0.5g is burned to form 0.08g of Magnesium Oxide. If the amount of Magnesium burned is doubled to 0.10g then so does the mass of Magnesium Oxide which doubles to 0.16g. The empirical formula of magnesium oxide is Other evidence to support my formula for Magnesium Oxide is the Ionic Bonding of the substance. This shows how the Magnesium and Oxygen atoms bond together. Evaluation I thought the method was a good way of carrying out the experiment because you could witness the making of Magnesium Oxide very clearly. But the method could have been unreliable as some faults could of occurred during the experiment; for example, the Bunsen Burner could have been off centre resulting in less heat to the crucible than possible. The crucible lid could have also been lifted off too many or too little times enabling the forming of Magnesium Oxide to be fair. The results were all reasonably accurate and most of the
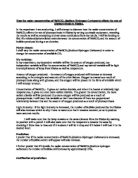
Insulation Materials Experiment Method We put 100ml of water at 80C into each of 6 beakers. Each beaker had a different material wrapped around it, and we measured the amount of time taken for the temperature of the water to decrease by 10C to 70C
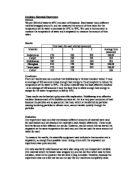
Insulation Materials Experiment Method We put 100ml of water at 80ºC into each of 6 beakers. Each beaker had a different material wrapped around it, and we measured the amount of time taken for the temperature of the water to decrease by 10ºC to 70ºC. We used a thermometer to measure the temperature of water and a stopwatch to measure tha amount of time taken. Results Time taken for each attempt (seconds) Material 2 3 Average time (seconds) Polystyrene 79 92 201 90.67 Carpet 201 90 91 94 Bubblewrap 90 225 94 203 Fibreglass 213 78 98 96.33 Tissue paper 72 69 225 88.67 Cotton 62 76 - 69 Conclusion From our results wee can conclude that bubblewrap is the best insulator tested. It took an average of 203 seconds to lose enough heat energy to the atmosphere to reduce the temperature of the water to 70ºC. The cotton material was the least effective insulator - at an average of 169 seconds it took the least time to allow enough heat energy to escape for the water temperature to fall by 10ºC. These results can be backed up by scientific explanation. Bubblewrap is an effective insulator because each of the bubbles contains air. Air is a very poor conductor of heat because the particles are so spaced out that heat, which is transferred by particles causing bordering particles to vibrate more, cannot transfer quickly through the particles.
Car Safety Features
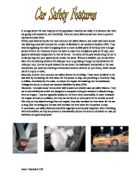
In an age where the vast majority of the population travel by car daily, it is obvious that there are going to be accidents, and thankfully, there are many features cars can have to prevent injuries and save lives. Firstly, seat-belts are by far the most common car safety feature, and crash tests have shown that wearing a seat belt reduces the number of fatalities in car accidents by about 50%. They work by applying the crash's stopping force to more durable parts of the body over a longer period of time. For instance, if your car were to crash into a telephone pole at 50 mph, your speed is obviously independent to that of the car. The force of the pole would bring the car to an abrupt stop, but your speed would remain the same. Without a seatbelt, you would either slam into the steering wheel at 50 miles per hour or go flying through the windshield at 50 miles per hour. Just as the pole slowed the car down, the dashboard, windshield or the road would slow you down by exerting a tremendous amount of force on your body, which would result in injury or death. Secondly, another very common car safety feature is the airbag. These work similarly to the seat belt, by increasing the time taken for the person to stop, and providing a 'cushiony' bag to inflate, stimulated by the crash, to reduce the impact of smashing into the dashboard. Airbags are found to reduce car accident

The effect of concentration on the rate of reaction between hydrochloric acid and magnesium ribbon
The effect of concentration on the rate of reaction between hydrochloric acid and magnesium ribbon Plan The rate of reaction can be affected by these factors, * Temperature * Concentration * Size of surface area * And by adding a catalyst I have chosen to investigate the effect of concentration. This will be done be investigated by diluting acid and timing how long it takes the same amount of magnesium ribbon to dissolve. I will obtain evidence by diluting the acid with 5ml of water each time, then timing how long it takes the magnesium ribbon to dissolve fully. The experiment will be done 6 times. This experiment will be repeated 2 times then the average of the two will be worked out. To make this a fair test the same amount of magnesium ribbon must be used. I have 60 cm of ribbon to use; each time the experiment is done I will use 4cm. This leaves 12cm to check any anomalous results. Also to keep a fair test the temperature must stay the same, the fore the experiments will all be carried out at room temperature. The apparatus I intend to use are as follows; Stop Clock, 50ml measuring cylinder and a 250ml-measuring beaker. Prediction I predict that the less concentrated the acid, the slower the rate of reaction. I predict this because of the collision theory. The higher the concentration the higher the number of collisions per second. This therefore gives a faster
Experiment to investigate the blind spot
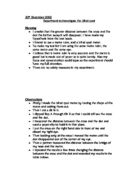
20th December 2002 Experiment to investigate the blind spot Planning * I predict that the greater distance between the cross and the dot the further away it will disappear. I have made my hypothesis from the text book. * I intend to use a metre ruler, and a blind spot meter. * To make my test fair I am using the same metre ruler, the same metre and the same eye. * I believe that is metre ruler is very accurate and the metre is good but is made out of paper so is quite bendy. Also my focus and concentration could lapse so the experiment should have my full attention. * There are no safety measures in my experiment. Observations * Firstly I made the blind spot metre by tracing the shape of the metre and cutting them out. * Then I cut a slit in it. * I slipped flap A through Slit B so that I could still see the cross and the dot. * I measured the distance between the cross and the dot and used a paper clip to hold it in that place. * I put the cross on the right hand side in front of me and closed my right eye. * Then looking only at the cross I moved the metre until the dot disappeared out of the corner of my eye. * Then a partner measured the distance between the bridge of my nose and the metre. * I repeated the results a few times changing the distance between the cross and the dot and recorded my results in the table below. Cm Between Cross and Dot Cm

Investigating the rate of reaction between potassium manganate (VII) solution and glucose solution.
Alex Cornwall-Tombs Chemistry investigation Investigating the rate of reaction between potassium manganate (VII) solution and glucose solution. Aim We are going to see if by varying the temperature of the potassium manganate solution and the glucose solution if it makes the experiment react faster or slower and if it takes a long or short time. Prediction I think that when the potassium manganate solution and the glucose solution is heated the reaction will speed up. This will speed up the reaction time because the particles are moving round more and have more energy. The faster the particles are going the more collisions. At a high temperature there will be more particles colliding with enough energy to make the reaction happen. When the temperature is increased the reaction time will speed up. Pre-tests The pre-tests are carried out to get a starting solution that is faster than the original mixture. I am doing this so I can speed up the results. I will use the same method as in my main method. Below are the tests I carried out: Amount of amount of amount of amount of time Potassium sulphuric water glucose (minutes) Manganate acid (ml) (ml) (ml) (ml) 4 25 50 10 21:33 takes to long 4 25 0 10 8:11 still to long 4 25 0 20 5:43 better 4 25 0 30 4:51 this is the one I will use 4 25 0 40 4:45 ok Method . Get the potassium
PROJECT : PLANT EXPERIMENTAL DESIGN i) PURPOSE: To determine whether added nutrients speed up seed germination.
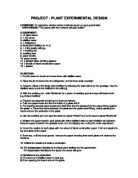
PROJECT : PLANT EXPERIMENTAL DESIGN i) PURPOSE: To determine whether added nutrients speed up seed germination. HYPOTHESES: "The plants with the nutrients will grow better." ii) EQUIPMENT: . 10 pinto beans 2. 1 500 ml jar 3. distilled water 4. 1 refrigerator 5. liquid plant fertilizer (5-10-5) 6. 1 4 litre plastic milk jug 7. 1 marking pen 8. masking tape 9. paper towels 0. paper towels 1. 2 straight sided drinking glasses 2. 2 sheets of black construction paper 3. 1 stapler iii) METHOD: . Put the beans in the jar and cover them with distilled water. 2. Place the jar of beans into the refrigerator, and let them soak overnight. 3. Prepare 4 litres of the liquid plant fertilizer by following the instructions on the package. Use the distilled water to mix the fertilizer in the milk jug. 4. With the marking pen, write ''Nutrients'' on a piece of masking tape and tape this label to the jug of liquid fertilizer. 5. Prepare two separate containers of beans as follows: a. Fold one paper towel and line the inside of a glass with it. b. Put together several paper towels and stuff them into the glasses hold the paper lining against the glass. c. Place five beans between the glass and the paper towel lining, evenly spacing the beans around the perimeter of the glass. 6. Use the marking pen and tape the label one glass ''Water'' and to the
Rate of Photosynthesis Investigation
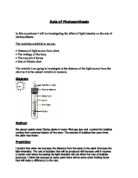
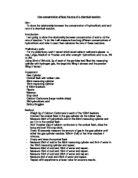
Rate of Photosynthesis In this experiment I will be investigating the effect of light intensity on the rate of photosynthesis. The variables available to me are: * Distance of light source from plant * The wattage of the lamp * The amount of leaves * Size of Elodea plant The variable I am going to investigate is the distance of the light source from the plant as it is the easiest variable to measure. Diagram Method We placed upside down Elodea plants in water filled gas jars and counted the bubbles coming from upturned bottom of the stem. The amount of bubbles that came from the plant was noted. Prediction I predict that when we decrease the distance from the lamp to the plant (increase the light intensity). The rate of bubbles that will be produced will increase until it reaches a certain rate where increasing the light intensity will not effect the rate of bubbles produced, I think this because at some point there will be some other limiting factor that will make a difference to the rate. Results Group A Distance from Plant (cm) 20 40 60 80 00 20 Bubbles in ten minutes 60 80 52 30 24 2 Group B Distance from Plant (cm) 20 40 60 80 00 20 Bubbles in ten minutes 90 05 62 24 2 0 Group C Distance from Plant (cm) 20 40 60 80 00 20 Bubbles in ten minutes 300 298 296 50 80 37 Temperature in degrees C 25 24 22 21 21 21

Write a review of GM Crops for a newsletter, 500 words limit.
GM Crops GM (genetically modified) crops are plants that are altered on a molecular level in a laboratory. It has been shown that by modifying these plants that scientists have been able to change their natural nutritional, insecticide resistance and flavor properties to produce better crops. A study conducted in 1999 showed that pollen from GM crops had caused unusually high mortality rates in Monarch butterfly caterpillars that had consumed pollen which had landed on nearby plants from wind pollination. Obviously, if there is an adverse effect on the Monarch butterfly population then the number of aphids will rise resulting in poorer crops. Scientists also fear that by modifying the genetics of the plant in order to produce B.t. (Bacillus thuringiensis (a bacterium which produces crystal proteins that are lethal to insect larvae)) will only be effective for a certain amount of time, because pests will develop a resistance to the B.t; as mosquitos did to DDT. Another concern is that plants that are modified for herbicide resistance will crossbreed with weeds to product weed variations that are also tolerant to herbicides. Studies have shown that where GM crops are planted in close proximity to non-GM crops that gene transfer does occur over a prolonged period. Until very recently, it was feared that eating GM foods could be harmful the body’s digestive tract. It was
How concentration effects the rate of a chemical reaction
How concentration effects the rate of a chemical reaction Aim: To show the relationship between the concentration of hydrochloric acid and rate of a chemical reaction. Introduction: I am going to show the relationship between concentration of acid and the rate of reaction. To do this I will measure how long different concentrations of hydrochloric acid take to react then calculate the rate of these reactions. Preliminary work: For my preliminary work I tested which sized calcium carbonate pieces to use, Large, Medium or Powder, and what strength Hydrochloric acid to us, 1M or 2M. Using 30ml of 2M acid, 3g of each of the particles had filled the measuring cylinder with hydrogen gas, the large bits filling it slowest and the powder filling it fastest. Equipment: Gas Cylinder Conical flask with rubber tube 50ml measuring cylinder 10ml measuring cylinder 6 100ml beakers Pipette Balance Stop clock Calcium Carbonate (large marble chips) 2M hydrochloric acid Safety Goggles Method - Weigh 3g of Calcium Carbonate in each of the 100ml beakers - Connect the conical flask to the gas cylinder via the rubber tube. - Measure 30ml of hydrochloric acid in the 50ml measuring cylinder and put it in to the conical flask - Add 1 beaker (3g) of calcium carbonate to the conical flask, close the bung and start the stop clock. - Every 10 seconds measure the amount of gas in