Apparatus
1 x 1 fruits (tomato, orange, apple, pear, grape)
5 x 1 test tubes
1 x 1 10cm3 graduated cylinder
1 x 2 syringe
1x 5 filter paper
1x1 funnel
1 x 1 Scalpel
1 x 1 Forcep
5 x 1 cuvette
1 x 1 colorimeter (COLOURWAVE CO7500 COLORIMETER)
1 x 1 test tube holder
1 x 1 electric water bath
1 x 1 beaker
12 cm3 benedict’s solution
Method
- five test tubes were labelled(S1, S2, S3, S4, S5)
- The Apples were crushed using a blender
- The juice obtained was filtered using filtering paper in order to obtain a clear liquid
- 4.5 ml of fruit juice was added in test tube S1 using a graduated syringe
- 4.5 ml of Benedict’s solution was added in test tube S1 using a syringe
- the mixture was heated carefully using an electric water bath at 45°C for 5 minutes
- A standard was obtained from the colorimeter using water
- The contents of test tube S1 was poured into a cuvette and placed in the colorimeter
- The reading was taken [depending on whether the colorimeter has an analog or digital meter, the output may be shown as transmittance (a linear scale from 0-100%) or as absorbance (a logarithmic scale from zero to infinity)]
- The procedure was repeated with the remaining four fruits.
- Results obtained were tabulated and a graph was drawn to compare the amount of glucose found in different fruits
Order in which fruits were crushed: Apple, pineapple, passion fruit, orange, tomato
The blender was washed before being used on other fruits.
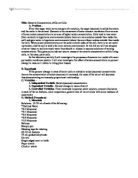
Protocol diagram
CUVETTE
JUICE &
BENEDICT’S SOLN
DISPLAY SCREEN
SAMPLE
COLORIMETER
Protocol diagram showing colorimeter and cuvettes
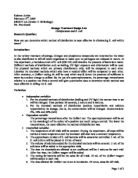
Photograph of experiment
Table showing raw data (data collected was in absolute value)
Processed data (showing percentage)
Error analysis
Graduated Cylinder: ±0.1
Thermometer: ± 0.5°C
Conclusion
In conclusion it was seen that not all fruits have a different concentration of reducing sugar. My hypothesis needs to be refuted. Both the apple and orange have the same amount of glucose present, which is 1%. However, pineapple, passion fruit and tomato all have different concentrations of glucose; 5%, 56%, and 3% respectively. The high amount of glucose found in passion fruits can be due the fact that when we blended the passion fruit we included the seeds. It was shown that one seed contains 1.64% of sucrose, glucose and fructose combined. There was an anomaly in the readings for the passion fruit concentration as there was a decrease of concentration from 63% to 1% and then back up to 28%. While the test tubes containing the benedict’s solution and the fruits juices samples were placed in the water bath, a colour change from blue to different shades of green was observed.
Evaluation
My investigation aimed at showing the concentration of reducing sugar (glucose) present in the different fruit juices. Several readings on the mixture after the reducing sugar test was done were taken every 2 minutes. This allowed us to obtain a wider range of results. It was a good and rather simple experiment due to the fact that a clear conclusion could be drawn out of it.
It is important to take into consideration that each fruit contains seeds which may have high glucose content. In this case, passion fruit seed was seen to have 1.64% of glucose, fructose and sucrose sugars combined. This may have biased the final results.
Replicate observations and multiple samples of fruit should have been tested. This would have given us a broader understanding of how glucose concentration in fruits could vary depending on their nature.
When testing for reducing sugar, the fruit samples containing benedict’s solution should have been placed in a boiling water bath at a temperature of 80°C for 5 minutes whereas in the experiment the water bath was only set to a temperature of 45°C. This may have caused a problem as the colour change from blue to a red precipitate could not have fully taken place at a temperature of 45°C.
Two benedict’s tests for each fruit juice should be done in order to obtain a more accurate average, as anomalies and discrepancies could be present in the results. We need to take into account the fact that different fruits come from different species; and discrepancies in the glucose concentrations may be present due to genetic variations. The species of one fruit containing the highest and the lowest amount of glucose should have been tested, and an average obtained.
Overall, I believe that the experiment was very interesting yet more results from a wider range of fruits from different species of plant could have been used.
Bibliography