- The age of all of the students was 16.
- Equal number of male and female students was tested.
- The students were selected randomly.
- Always the hand span of the left hand was measured. The height of all of the students was measured after they had taken their shoes off.
Results: -
Table 1. The height and hand span of 16 year old male students presented in increasing order of hand span
Table 1. The height and hand span of 16 year old female students presented in increasing order of hand span
Table 3. Results of different statistical test on the height and hand span of 16 year old students.
Graph 1 shows the relationship between the height and hand span in male students. The majority of the points are concentrated close to the trend line. However there are some anomalies present in the scatter graph such as a hand span of 22.4±1cm and height of 169.5±2cm. the shape of the scatter graph indicates that there is a positive correlation between the two variables. Graph 2 shows also a strong correlation between the height and hand span of female students as most of the points are concentrated near the trend line. Some anomalies are present here as well such as a hand span of 19.2±1cm and height of 153.5±1cm. The range of data in Table 3 also shows that females have smaller hand span and height compared to males.
The standard deviation calculated in Table 3 shows how widely spread the data points are around the average. The standard deviation for hand span is 1.6 for males and 1.1 for females. This indicates that hand span of the male students is relatively more varied than the female hand span. When it comes to height, the standard deviation for male students was found to be 6.8 while for female it was 6.4. Therefore again there is slightly more variation in the height of the male students compared to the female students.
Graph 3 is a scatter graph representation of all the 54 samples measured from both male and female students. The majority of the points are clustered close to the trend line indicating a positive correlation. To prove if there is a positive correlation and to give the correlation between height and hand span a precise value, a Spearman's Rank Correlation test can be done. This is done by first formulating a table. In the first column the values for the first variable (hand span) were listed in increasing order. Then in the next column they were ranked with the lowest values getting the lowest rank. Values which are the same are given a mean share rank. Then the corresponding dependent variable (height) was listed in the third column and ranked in the forth. Finally the differences in the ranks for each sample were squared and added together resulting in a value of 5293. This was then substituted in the equation below to get the correlation value.
r = 1- (6 X ∑ D2/n (n2-1), where n = number of samples
r = 1- (6 x 5293/52(2704- 1)
= 1- (6 X 5293/52(2703)
= 1-(0.225)
= 0.774
In this case, the critical value for 52 samples is 0.274. The calculated value is greater than the critical value, so there is a positive correlation between the two variables.
Conclusion: - from graph 1 and graph 2 it was evident that both male and female students at age 16 have positive correlation between their hand spans and height separately. When the results of both sexes were merged together in graph 3, there was a positive correlation between the height and hand span with some anomalies. Finally using Spearman's Rank Correlation test it was proven that there is a positive correlation between length of hand span and height as the hypothesis states in the beginning. One possible reason for this may due to gene linkage. The genes that create these characteristics may be positioned on the same chromosome so that they become linked, and are inherited together. This may cause the two characteristics to become associated so that a long person will also have large hands.
Evaluation and limitation: - this experiment was done in a school environment so it was relatively easy to get samples. It can also be performed without the need of assistance from others. However, there are certain factors that had an impact on the results obtained. One factor is the age of the students. All of the students were teenagers of age 16. Therefore they have not attained their maximum growth and therefore their maximum hand span and height. The majority of people stop growing at the age of 18. Below this age the rate of growth varies and is dependent on different factors.
One factor is the timing of the onset of puberty. Puberty is initiated by GnRH hormonal signals from the hypothalamus in the brain. This causes the release of FSH and LH hormones from the gonadotrophs found in the anterior pituitary gland. These two hormones regulate the development, growth, pubertal maturation, and reproductive processes of the body. In this experiment both male and females were used. All were at the age of 16 in which puberty is still taking place. So they have not achieved maximum growth at the time of measurements. It is also the case that females enter puberty earlier than males and even between males and females, the onset of puberty varies greatly. This in turn will greatly affect the results obtained. The timing of puberty and thereby growth of a person is also affected by environmental factors such as diet of a person.
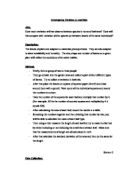
Another limitation in this experiment is the measurement of the hand span. The students were asked to place the tip of their little finger on a ruler as seen in picture 1 and stretch their hands. Using this method meant that the measurement relied heavily on the flexibility of the hands being constant amongst all those sampled. This was not the case all the time. Total number of samples was 52 only.
Improvements: - instead of using teenagers to test the hypothesis adults of age 21 can be used since they have most likely attained their maximum growth. By taking more samples the uncertainty due to the measurement of the hand span can be reduced.