Investigation into the effect of varying light levels on the transpiration rate of the Cherry laurel, Prunus laurocerasus L.
Introduction
In vascular plants movement is water up the xylem from the roots to the leaves is an essential process, responsible for supplying the plants tissues with water and maintaining cell turgor (which has a role in preventing the plant wilting). Aside from the weak “push” effect of the difference in water potential between the soil and the roots, the main force for transpiration in water evaporating from the spongy mesophyll tissue in plant leaves. The rate of evaporation depends a number of factors- some directly affecting the rate at which water evaporates (such as temperature, wind speed, humidity) and others affecting the number of stomata that are open, such as light levels.
The use of a gas pressure sensor is a well-documented way to measure the rate of a plant’s transpiration. The plant cutting is inserted cut-end-on to a plastic tube full of water, the other end being connected to a gas pressure sensor. As the plant takes up the water through the transpiration stream the volume within the tubing deceases, and the pressure changes with it. So if the change in pressure is recorded over a period of time the transpiration rate can be calculated from these values
Hypothesis
There are two factors that may affect the rate of transpiration elative to temperature. Firstly is the simple physical effect- light radiation will warm the laves (and consequently the water within them), thus increasing the rate of evaporation, speeding the transpiration stream- as a result the pressure in the tubing would drop more rapidly. However, it is known that the stomata are light sensitive, usually closing during the night (when photosynthesis is impossible) - i.e. at low light levels, and then opening during the day for gaseous exchange for photosynthesis. It may be that at very high light levels some stomata may close (or all of them may partially close) in order to mitigate water loss. However, I think that overall the direct effect of increasing light intensity will result in increasing rate of transpiration. In other words the two would be expected to have a proportional relationship.
Equipment
- Laptop
- Vernier go-link computer interface x 2
- Vernier gas pressure sensor x 1
- Philip Harris light intensity sensor
- Clamp stand x 2
- Clamps x 3
- Scalpel
- 100cm ruler (±0.5cm)
- 100 Watt light source (lamp)
- Plastic syringe
- Clear plastic tubing approx. length 40cm, approx diameter 0.5cm
- Vaseline
- Cutting of cherry laurel, Prunus laurocerasus approx. 30cm
- Water
- White paper
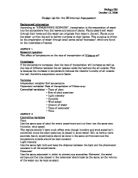
Figure 1:
Method
Equipment setup:
1. Clamp stand, temperature sensor and gas pressure sensor positioned as shown in figure 1, in a location where humidity, temperature and light levels are most easily controlled (i.e. at a constant level)
2. Plastic tubing is prepared-
- syringe connected to tubing
- water drawn up into tubing using syringe
- Tube is bent into U-shape. Syringe is removed
3. Plant cutting is selected, and stem us cut at 45° angle using scalpel in order to maximize surface area available. Stem directly above cut smeared with Vaseline (waterproofing agent)
4. Plant connected to tubing:
- Tubing is connected at one end to the gas pressure sensor
- Tubing is connected at its other end to the lower clamp on the second clamp stand, which is positioned approx. 8cm below the gas pressure sensor.
- Plant cutting is inserted cut-end-on into the tubing, care being taken that air bubbles are not present anywhere in the tubing