Background and Theory
To determine the effect of surface area on the rate of reaction, a known mass of calcium carbonate granules and powder are each placed in a flask, into which standard dilute hydrochloric acid is added. An acid reacts with a carbonate to give a chloride, water and carbon dioxide. Over time, the mass of calcium carbonate decreases while the volume of gas, carbon dioxide, increases. The more gas that is produced in the reaction, the faster the reaction is occurring. This can be measured by means of a graduated gas syringe. The reaction can be represented by the equation:
CaCO3(s) + 2HCl(aq) CaCl2(aq) + H2O(l) + CO2(g)
The results of the two reactions are plotted on the same axes of a graph of volume of CO2 produced against the time taken. The gradient of the curves are used to judge the rate of the reaction; the steeper the slope, the faster is the reaction. The time taken to reach the end of reaction (curve to become horizontal) also indicates the speed of the reaction; the less reaction time needed, the faster is the reaction.
Since the concentration of HCl(aq) and mass of CaCO3 are constant, the volume of CO2 produced is constant. However, the more finely divided a solid is, the larger is its surface area. According to the collision theory, the rate of a reaction is directly proportional to the number of effective collisions per second between the reactant molecules. Increasing the surface area increases the number of effective collisions per unit time. Therefore, powdered calcium carbonate reacts much faster with dilute hydrochloric acid than if the same mass is present as granules of marble or limestone.
Apparatus
- Mortar and pestle
- Flask and bung
- Thistle funnel
- Graduated gas syringe
- Stopwatch
Chemicals
-
1 M 0.025 dm3 dilute hydrochloric acid (HCl) solution
-
10 g of calcium carbonate (CaCO3)
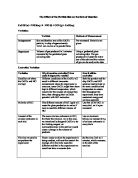
Safety Materials
Diagram
Procedure
- Safety glasses and gloves were worn.
- Known mass (10 g) of calcium carbonate granules was placed in a flask and the apparatus was set up as shown, with the plunger of the graduated gas syringe pushed all the way in to remove air from within the syringe.
-
A standard (1M 0.025 dm3) dilute hydrochloric acid solution was poured into the flask through a thistle funnel and the stopwatch was immediately started.
- At every 15 seconds interval, the volume of carbon dioxide was read and the result was recorded.
- At the end of the experiment, a graph of volume of carbon dioxide produced against time was plotted.
- The same mass (10 g) of calcium carbonate granules were obtained and grounded to fine powder in a mortar using a pestle.
- The powder was transferred to the flask and the above procedures were repeated, measuring the volume of carbon dioxide produced every 15 seconds interval.
- Another graph of volume of carbon dioxide produced against time was plotted on the same axes.
Table of Results
Table 1: Calcium carbonate granules
Table 2: Calcium carbonate fine powder
Graph
Conclusion
The gradient of the curve for calcium carbonate fine powder is steeper than that for calcium carbonate granules. Therefore, the rate of reaction for the fine powder is faster than that for the granules. When the reactants are reacted completely, the rate becomes constant in both reactions.