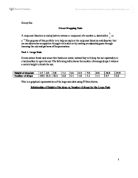
This is a graphical representation of the large nuts data using TI InterActive.
Relationship of Height of the drop vs. Number of drops for the Large Nuts
The variables in this data are that the height of the nut dropped affected the frequency, and this variable is put into an average. Another variable is the frequency of drops is also an average, where it is impossible to have 6.8 times of drops to open a nut. This has been converted into an average because it provides much clearer data, which could be put into one graph and distinguish the equation for it. Another variable is the size of the nut, since it takes a higher number of drops to break it at a lower height, but at a higher height it takes fewer drops.
The parameters in this data are for the reciprocal function +d
The parameters are that a is the vertical stretch, b is the horizontal shift and the vertical asymptote, c is the rate of fall or the vertical shift, and d is the horizontal asymptote.
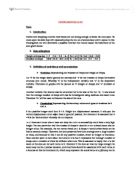
The function that models the behavior of the large nut graph is the reciprocal function as we can see below. I chose this function because it was they only function that met the criteria which were that the graph had to have the standard hyperbola (which is the reciprocal function) and it had to have a vertical asymptote because it would at least take one drop to break the nut.
Relationship of Height of the drop vs. Number of drops for the Large Nuts
The graph below is the combination of my equation and the large nut data.
Relationship of Height of the drop vs. Number of drops for the Large Nuts
The graph that I determined is similar to the data except that, it needs to be translated to the left a little bit and the rate of the drop and the horizontal asymptote should increase. The refined equation is f(x) = (70(x-.1)-1.85)+2
To find another function that models the data I used my graphing calculator to find the Power Regression. The Power function is (a)(xb) and the function that I found was (46.10)(x -1.15).