If we consider an infinitely extended graph, then we could say that the values of ‘a’ could be infinite apart from zero as the curve would vertically stretch or contract at any number apart from zero.
Y=Sin bX b=1
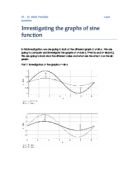
For instance, considering the formula Y=a sin bX + c, we find that the letter ‘b’ modifies the period of the curve. For instance, if we increase its value, the curve will horizontally contract with a period of the same value. If however we reduce the value, then the curve will horizontally stretch with a period of the same value. Finally, if we inverse the sign of the period for example we change ‘b’ into ‘-b’, then the curve will reflect through the centreline.
If we consider an infinitely extended graph, then we could say that the values of ‘b’ could be infinite apart from zero as the curve would horizontally stretch or contract at any number apart from zero.
Y=Sin X + c c=0
Hence, we can see that adding or subtracting ‘c’ results in an leftward and rightward translation of the curve. The curve is translated horizontally by a scale factor of the magnitude of ‘c’. The positive value translates to the left while a negative value translates to the right.
The possible values of c could be infinite as there can be an infinite translation of the curve.
To conclude, we should say that we can predict the shape and position of the graph of y=Asin(B(x+C) from the above information on A, B and C. We could say anticipate the vertical stretch of the curve by modifying the magnitude of A and inverse it by making A negative. Also, we could increase or decrease the cycles of the curves according to its period by changing the value of B. Finally, we could decide the horizontal translation of the curve to the left by adding a given C value or to the right while subtracting a given value of C.