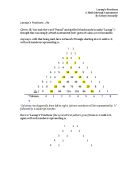
*Column 0 1 2 3 4 5 6 7 8 9
*Columns rise diagonally from left to right. Column numbers will be represented by “c” followed by a subscript number.
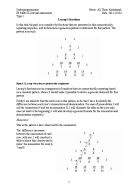
Here is “Lacsap’s” Fractions (the symmetrical pattern given) from n=1 until n=5, again with red numbers representing n:
- 1 1
- 1 1
- 1 1
- 1 1
- 1 1
If you will notice, row 1 (n=1) has a numerator of 1; row 2 has a numerator of 3; row 3 has a numerator of 6, row 4 has a numerator of 10, and row 5 has a numerator of 15.
The numbers of these numerators can be found in the above example of Pascal’s Triangle (column 2 or c2; or c7 but we’ll focus on c2). The number 1 can be found when n=2 in the second column (c2) of the triangle, which is the numerator of row 1 in Lacsap’s Fractions. Furthermore, when n=3 in the second column (c2) of Pascal’s Triangle, the number 3 is found, which is the numerator in Lacsap’s Fractions when n=2. This pattern continues, which brings me to the idea that the numerator is found by adding 1 to n in Lacsap’s fractions and finding that number in c2 of Pascal’s Triangle. For example, when n=3 in Lacsap’s Fractions, the numerator is 6. When you add 1 to 3, the result is 4; find n=4 in Pascal’s Triangle and find column 2. You will find the number 6.
I will demonstrate this when n=4 and n=5 in Lacsap’s Fractions as well and also when n=6, which was not included in the given symmetrical pattern.
When n=4, 4+1=5. Find n=5 in Pascal’s Triangle in c2 and you will see the number 10.
When n=5, 5+1=6. Find n=6 in Pascal’s Triangle in c2 and you will see the number 15.
When n=6, 6+1=7. Find n=7 in Pascal’s Triangle in c2 and you will see the number 21.
Therefore, the numerator of the sixth row would be 21.
Now I will plot the relations between the row number, n, of the given symmetrical pattern “Lascap’s Fractions” and it’s numerator.
The pattern of the plotted points is clearly not linear.
A linear line is y = mx + b
To find m we would need the distance between two points, or slope.
The distance between the points when n=1 and n=2:
However, the distance between the points when n=2 and n=3:
If the equation were linear then the slope would remain consistent.
Therefore I will go past 1st differences and look at 2nd differences to determine whether or not this is a quadratic equation.
Since the second differences are the same, I am able to understand that this is a quadratic equation.
Formula for quadratic equation: y = ax2 + bx +c where a≠0.
Now I will plug in x and y values for the equation using this chart:
I used the quadratic equation to solve for row 2 and row 4. I used substitution to find the missing variables a and b to arrive at a general statement of
y = x2 + x
where y is the numerator and x is the row number (n)
I have already discovered that the numerator when n=6 is 21.
y = (6)2 + (6)
y = (36)+ (6)
y = 18 + 3
y = 21
Now I will test the statement when n=7.
y = (7)2 + (7)
y = (49)+ (7)
y= 24.5 + 3.5
y = 28
This is correct because when n=7, 7+1=8. Find n=8 in Pascal’s Triangle in c2 and you will see the number 28. Now that I have discovered the general statement for the numerator, it is time to work on the denominator.
1 1
1 1
1 1
1 1
1 1
Column 1 2 3 4 5
There is a pattern between the differences of numerator and denominator for each row. In row 1, for example, is displayed and there is a difference of zero for numerator and denominator. This continues in the symmetrical pattern.